Fusedash is an interface agent that can take your data and create a custom dashboard, data visualizations, or data rich report. Let Fusedash show you what's possible with your data.
Mauris dolor felis, sagittis at, luctus sed, aliquam non, tellus. Nam sed tellus id magna elementum tincidunt.
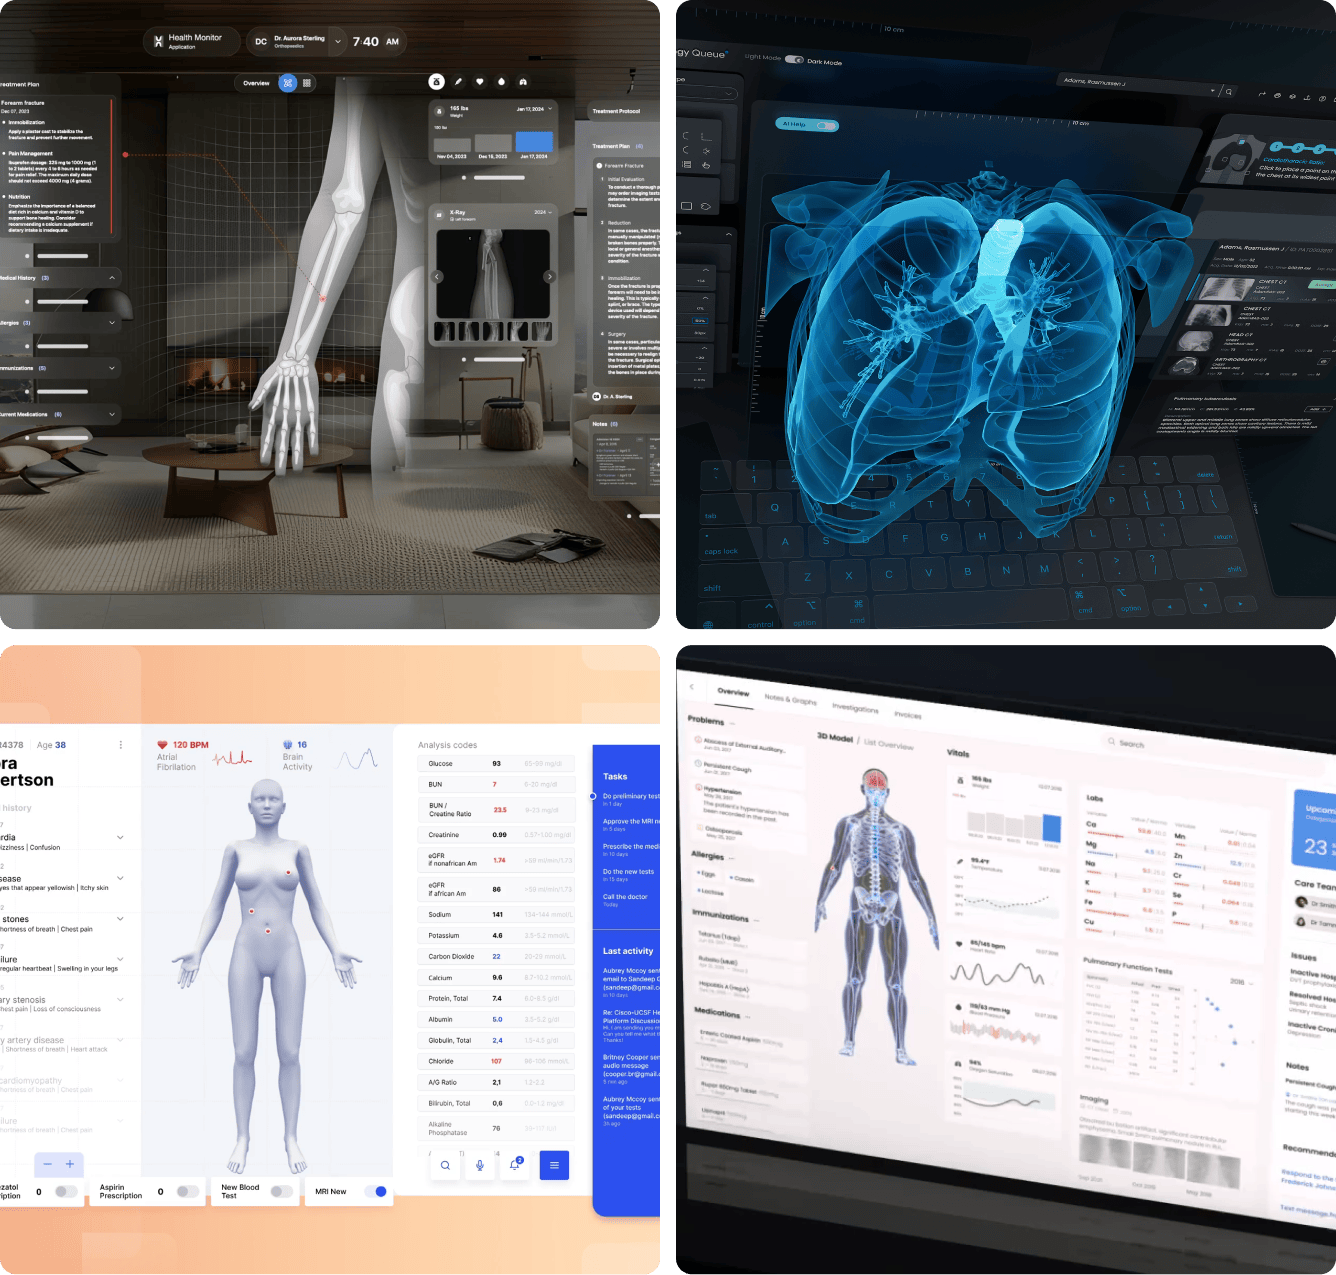
Interactive 3d body for Referralmd
Mauris dolor felis, sagittis at, luctus sed, aliquam non, tellus. Nam sed tellus id magna elementum tincidunt.
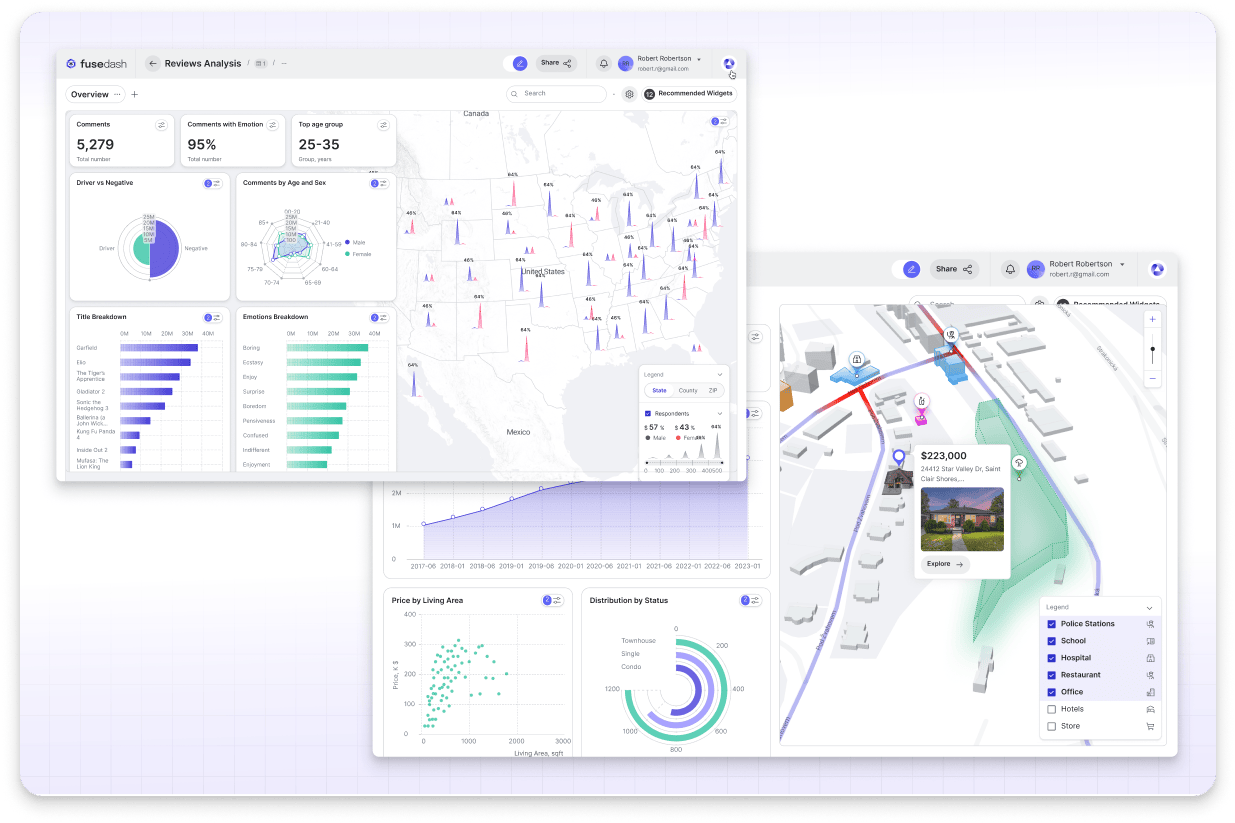
Interactive Dashboard for DHCS
Mauris dolor felis, sagittis at, luctus sed, aliquam non, tellus. Nam sed tellus id magna elementum tincidunt.
Multi layer map for Intercity
Mauris dolor felis, sagittis at, luctus sed, aliquam non, tellus. Nam sed tellus id magna elementum tincidunt.
Interactive 3d body for Referralmd
Mauris dolor felis, sagittis at, luctus sed, aliquam non, tellus. Nam sed tellus id magna elementum tincidunt.
Interactive Dashboard for DHCS
Mauris dolor felis, sagittis at, luctus sed, aliquam non, tellus. Nam sed tellus id magna elementum tincidunt.
Trusted by the biggest companies
# Master Wireframe
Ways to see your results
Fusedash is simple to use while still offering an incredibly powerful list of tools and services for every size business, or industry need. It's up to you how far you want to go.
# Master Wireframe
Ways to see your results
Fusedash is simple to use while still offering an incredibly powerful list of tools and services for every size business, or industry need. It's up to you how far you want to go.
Upload your CSV
Connect your API Rest
Connect to Public data
Fusedash Builder
This awesome element has more variants and fully customizable property.
Data Made Beautiful: Ideal for creating visually appealing and quickly digestible insights.
# Solutions
Power-Packed Features
Data Made Beautiful: Ideal for creating visually appealing and quickly digestible insights.
Interactive Interfaces
Dashboards
Design fully customizable dashboards with your data in minutes. Add features or filters as needed, change data visualizations as much as you like, and then add your own explainer copy and you're ready for prime time.
Most of the data visualization world agrees that if you can format your data into a simple storytelling format, the overall effectiveness of your data visualizations increases exponentially. This is particularly true when you are looking to increase engagement and improve comprehension with your users.
We all see numbers and graphs a little different. What makes sense to one audience can be highly confusing to another. This is why the Fusedash chart generator offers countless options, as well as numerous ways to customize your selected to chart and with the visual specificity your audience will understand and immediately respond to.
Maps are one of the, if not, the most multidimensional data visualization tools that exist. Through map styles like choropleth (color shading), cartograms, symbol maps, and heat maps; our map functionality can effectively and clearly display countless variables simultaneously.
With our AI Chat feature, users have access to a system that can adapt to individual user preferences, communication styles, and specific needs over time. This involves building user profiles that track preferred terminology, common use cases, and interaction patterns.
You can easily change the number of features and their properties. With or without background, add text, link or simple arrow, change the icon to number, it's fully up to you.
# Master Wireframe
Ways to see the results
You can easily change the number of features and their properties. With or without background, add text, link or simple arrow, change the icon to number, it's fully up to you.
Public Link
This awesome element has more variants and fully customizable property.
White Labeled
This awesome element has more variants and fully customizable property.
API Rest
This awesome element has more variants and fully customizable property.
Embedded
This awesome element has more variants and fully customizable property.
Fusedash Builder
This awesome element has more variants and fully customizable property.
# Why Fusedash
Product Explanation
To create reliable revenue streams businesses from every industry need to understand what drives their sales - and to do that you need to analyze your data, and to do that you need to create data visualizations - unless you’re some kind of trend spotting spreadsheet guru.
For Product Owners
Understanding and monitoring the success and pitfalls of your product in real-time is simply an unfair advantage over your competitors.