AI Data Visualization Platform for Dashboards
Connect your data and build interactive dashboards, charts, and reports in minutes. Fusedash helps you monitor real-time KPIs, explore what changed, and share a clear view your team can trust. Use AI to generate visuals, spot trends faster, and ask questions about your metrics without digging through endless reports.
Built for KPI dashboards, executive reviews, and real-time monitoring.
Connect your Data
Start from a CSV, connect an API, or enrich your dataset with public sources. Then use the same data to build dashboards, charts, maps, and report-style views, depending on who needs to see the results.
Connect your Data
Start from a CSV, connect an API, or enrich your dataset with public sources. Then use the same data to build dashboards, charts, maps, and report-style views, depending on who needs to see the results.
Upload your CSV
Connect your Rest API
Connect Public Data


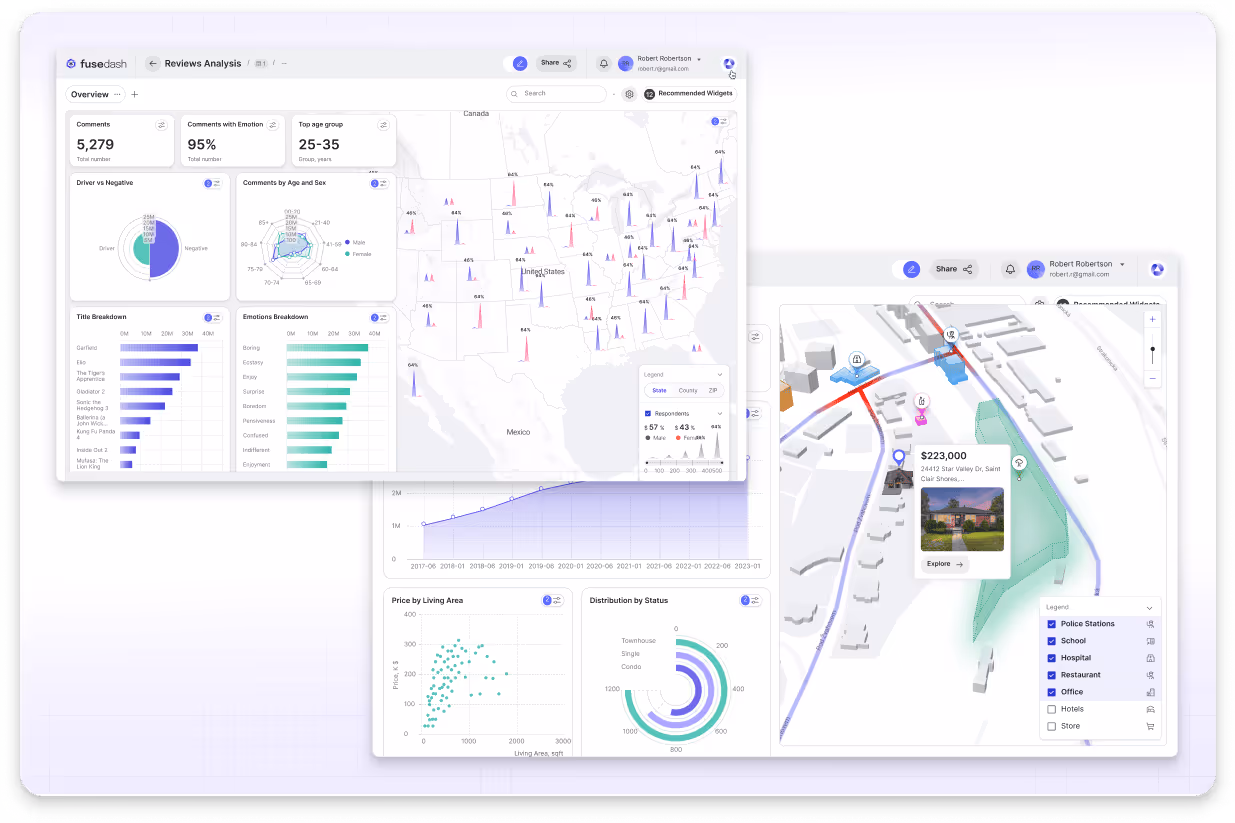
Fusedash Builder
Build dashboards, charts, and reports from your data in minutes. Customize layouts, metrics, and visuals without extra work.
View on Fusedash
Copy Embedded item
Custom Engine Platform


Power-Packed Features
Data made beautiful and actionable. Build dashboards, charts, and reports that help your team understand insights in seconds.
Power-Packed Features
Data made beautiful and actionable. Build dashboards, charts, and reports that help your team understand insights in seconds.

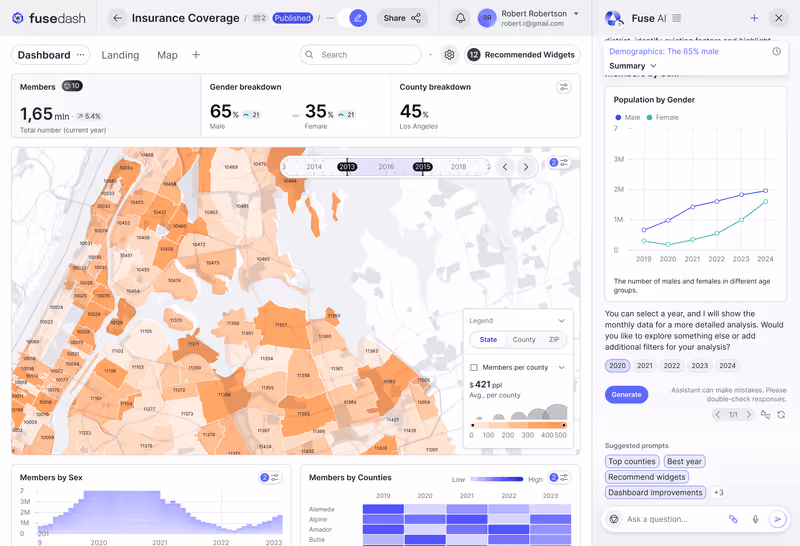
Dashboards
Build interactive dashboards in minutes. Customize KPIs, filters, and layouts, then share a clean dashboard UI your team can act on fast.
- Real-time metrics, KPIs, and filters
- Shareable dashboard UI for teams
- Built for ops, product, and performance
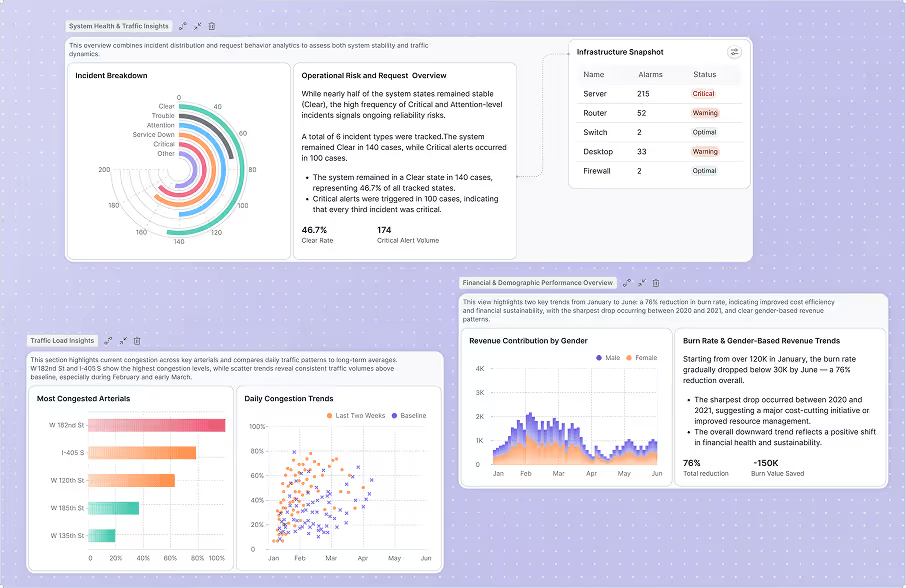
Storytelling
Turn charts into clear narratives with data visualization storytelling. Add context, highlight trends, and present insights in a format executives understand.
- Turn charts into a clear story
- Add context, notes, and takeaways
- Great for executive reporting updates
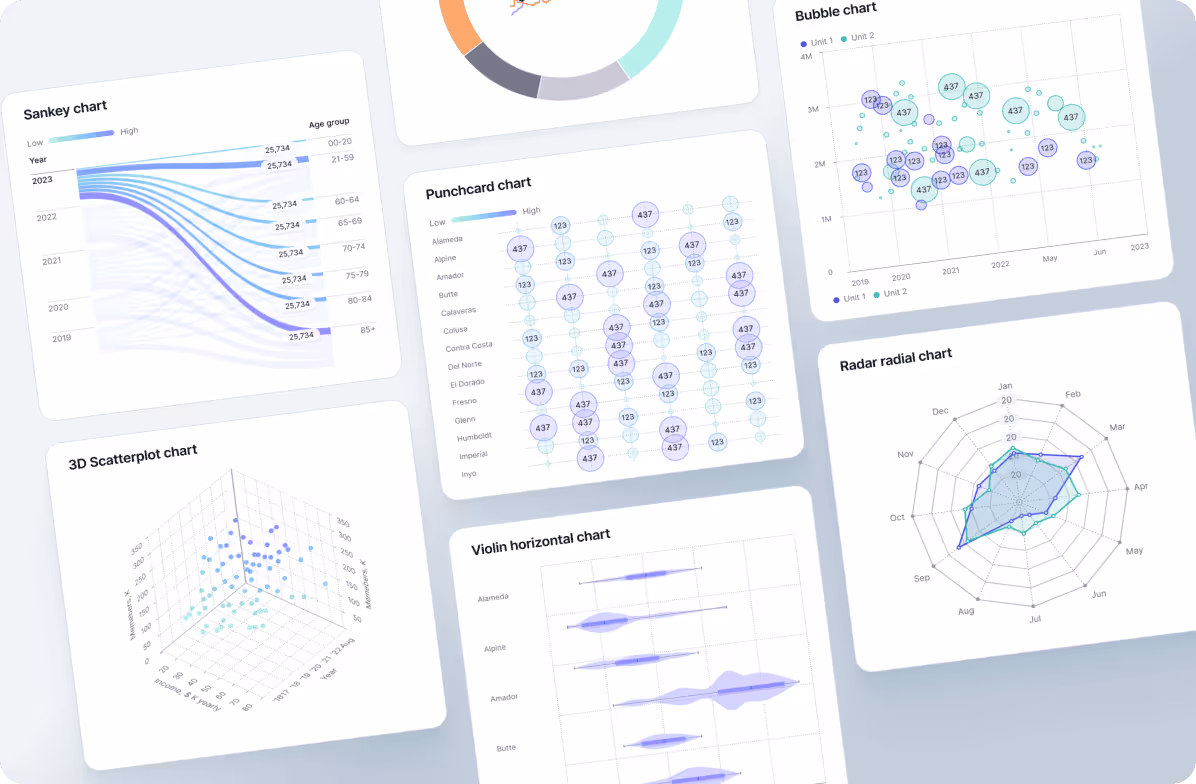
Charts
Use an AI chart generator to create interactive charts that fit your audience. Pick the right chart type, adjust styling, and drop visuals into dashboards in seconds.
- AI chart generator for fast visuals
- Choose the right chart type
- Drop charts into dashboards instantly
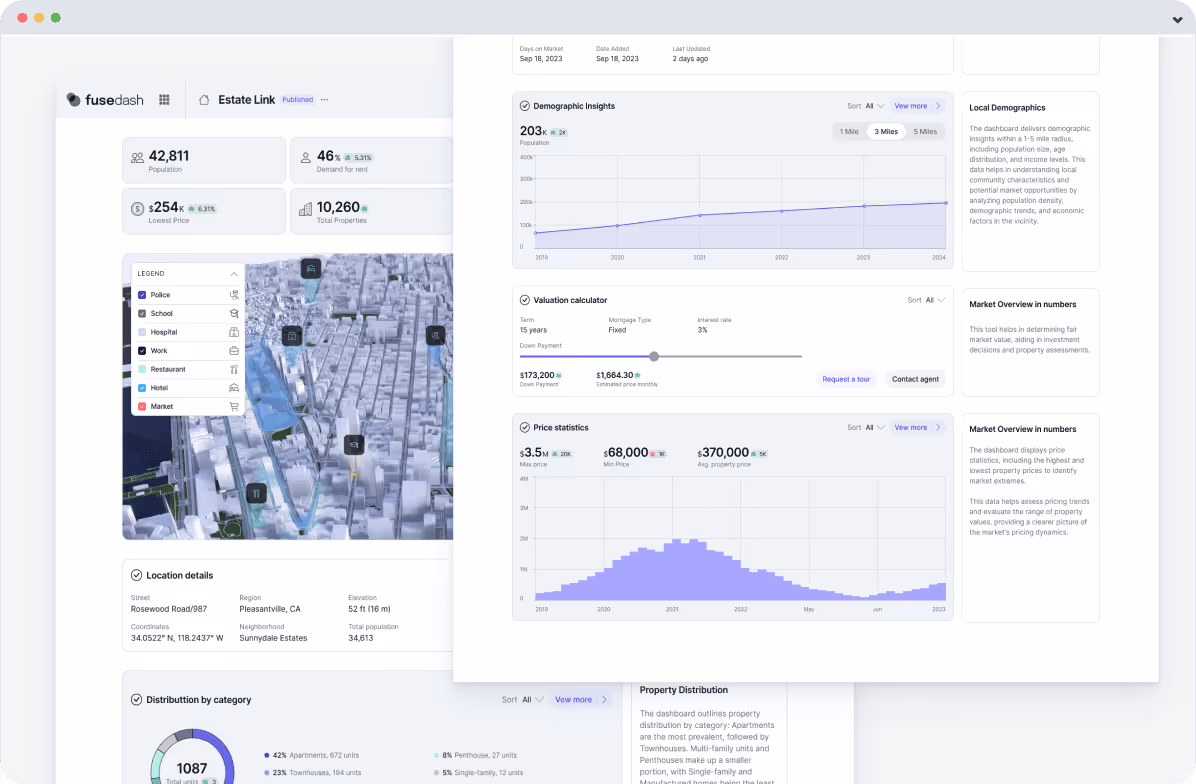
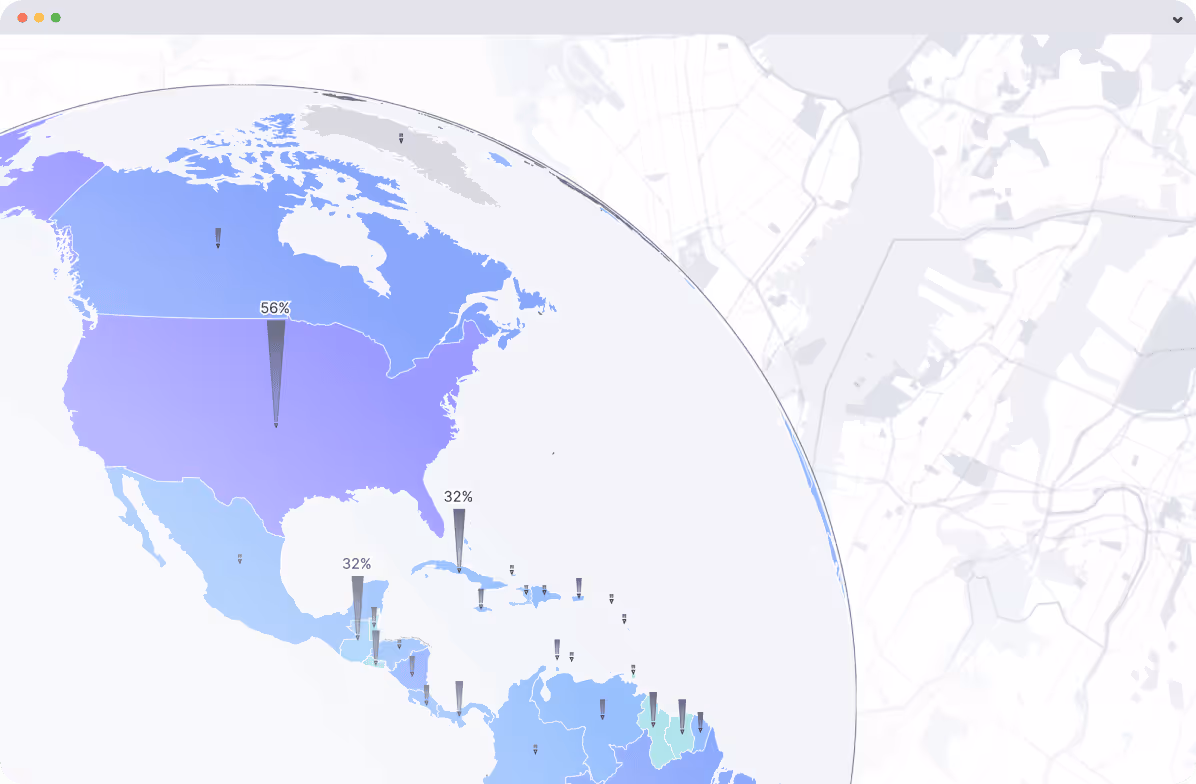
Maps
Explore regional patterns with map visualizations choropleths, heatmaps, and symbol maps. Great for location-based insights across sales, ops, and performance.
- Map visualizations for location insights
- Choropleth maps, heatmaps, point maps
- Track sales, coverage, and performance
Chat
Ask questions in plain language and explore insights faster. Fusedash Chat helps you navigate dashboards and metrics without digging through menus.
- Ask questions in plain language
- Get answers with charts and context
- Drill down by region, product, channel
Real-Time Interface
Monitor live metrics with real-time data visualization. Auto-refresh dashboards and stay on top of what’s happening without writing code.
- Real time data visualization that updates
- Alerts for spikes, drops, and anomalies
- Monitor live KPIs without code

Why Fusedash
Fusedash helps teams turn data into interactive dashboards, charts, and real-time reports. Track KPIs, spot trends faster, and share insights your team can act on.
Why Fusedash
Fusedash helps teams turn data into interactive dashboards, charts, and real-time reports. Track KPIs, spot trends faster, and share insights your team can act on.
For Product Owners
Track key metrics in real time and spot changes early. Share dashboards with design and engineering to align decisions faster.

For Business Teams
Create dashboards and reports for sales, ops, and performance without complex setup.

For BI & ML Teams
Build flexible dashboards, visual reports, and real-time views. Share insights and iterate faster with stakeholders.


Turn your data into dashboards
Start a free trial or request a demo to see Fusedash in action.