Let's turn your data into a product with our Fusedash platform.
We bring the ready-built tech and design; you bring the data, and we grow the new product together. You have data others want, the question is, why not monetize it?
Your Raw Data Made Usable and Marketable with Fusedash
Upload a CSV, connect a REST API or link any MCP-compatible AI model. One data connection powers your entire workspace. No data warehouse required. No engineering support needed.
Upload your Data
Connect your Rest API
Connect MCP

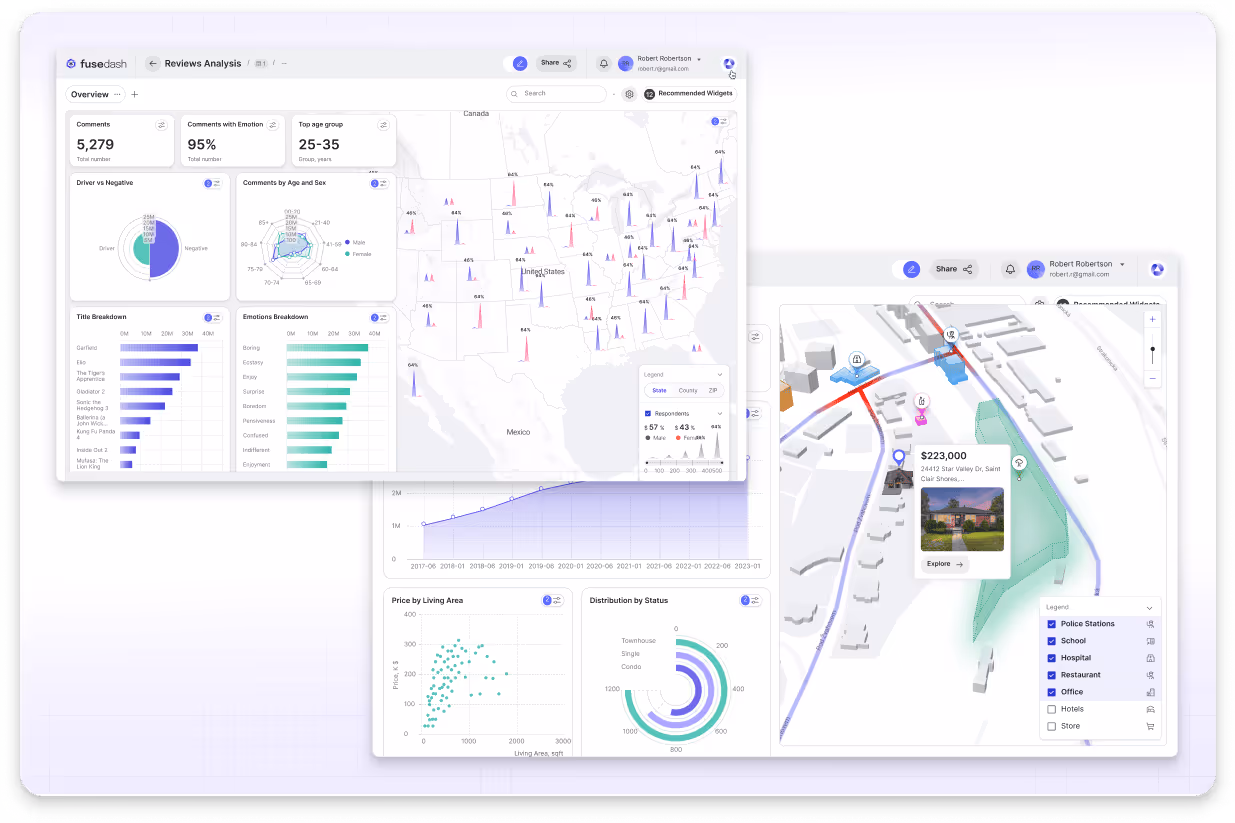
Fusedash Builder
Build dashboards, charts, and reports from your data in minutes. Customize layouts, metrics, and visuals without extra work.
View on Fusedash
Copy Embedded item
Custom Engine Platform

One Multi-Purpose Platform for Dashboards, Reports, and Data Visualizations
Fusedash generates the right format for every audience and every decision. From daily KPI tracking to executive reporting.

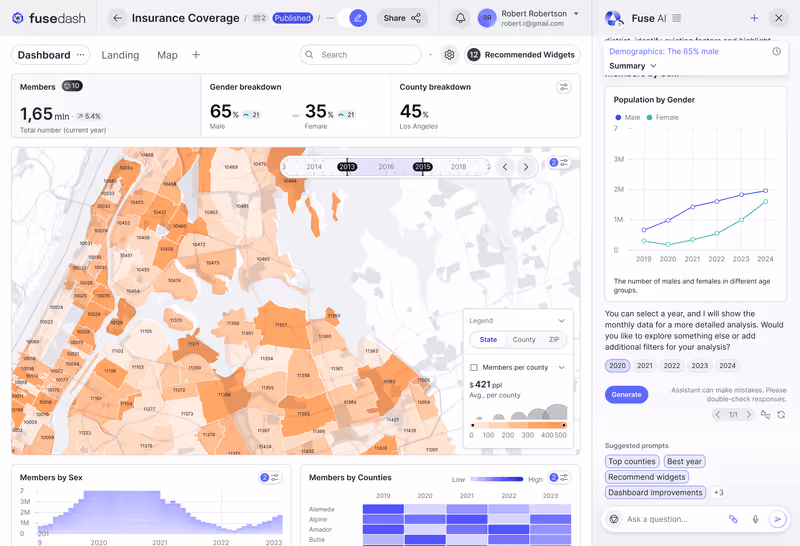
Dashboards
Generate interactive business intelligence dashboards with KPI cards, filters, and drill-downs. Including, views for finance, marketing, operations and product. Share one source of truth your whole team can act on.
- Real-time metrics, KPIs, and filters
- Shareable dashboard UI for teams
- Built for ops, product, and performance
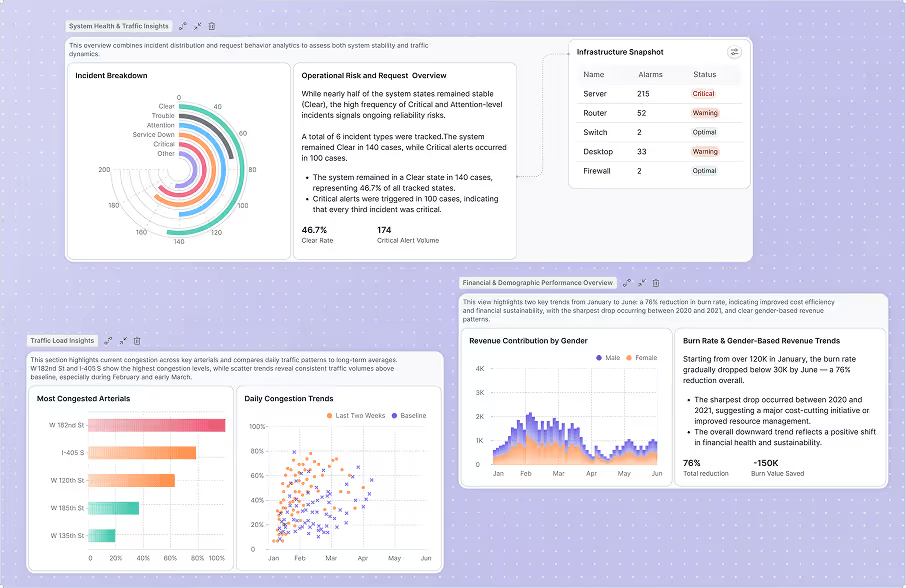
Storytelling
Turn dashboard data into narrative reports with context, takeaways and clear explanations of what changed and why. Perfect for leadership reviews and stakeholder reporting.
- Turn charts into a clear story
- Add context, notes, and takeaways
- Great for executive reporting updates
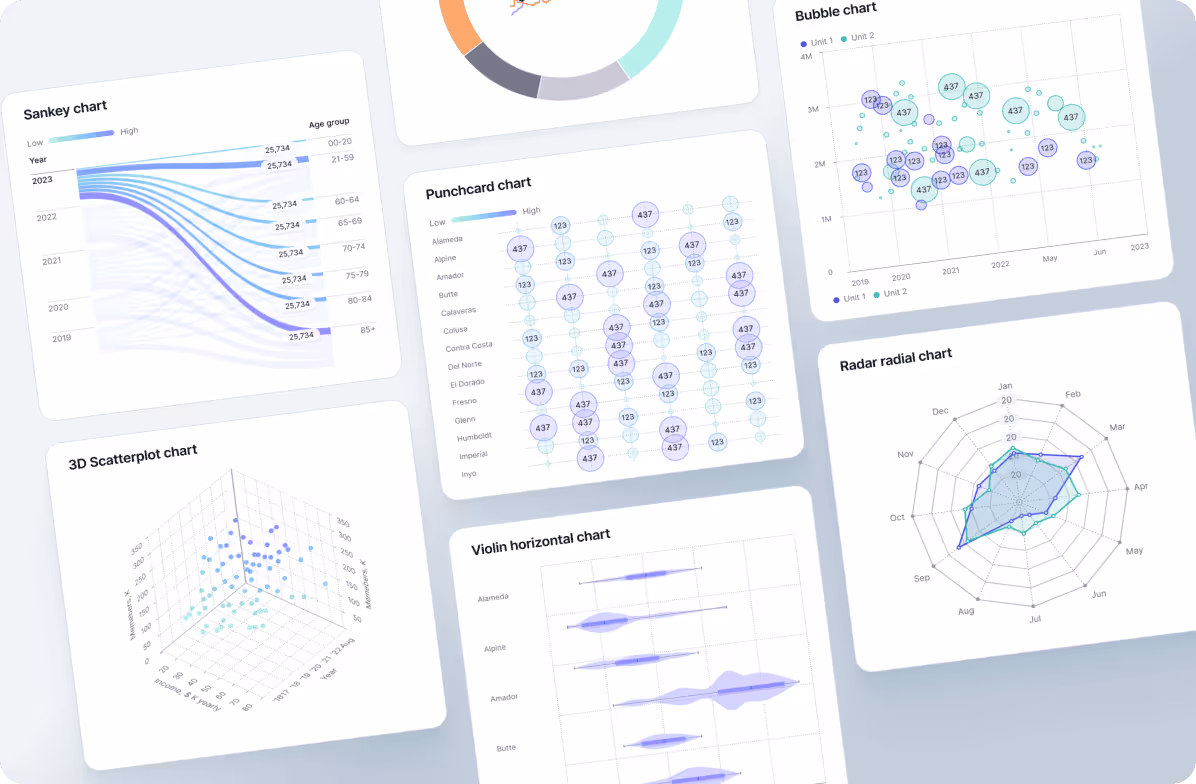
Charts
Use the AI chart generator to create the right visual for your data in seconds. Pick the chart type, adjust the styling and add charts to dashboards or share them as a standalone.
- AI chart generator for fast visuals
- Choose the right chart type
- Drop charts into dashboards instantly
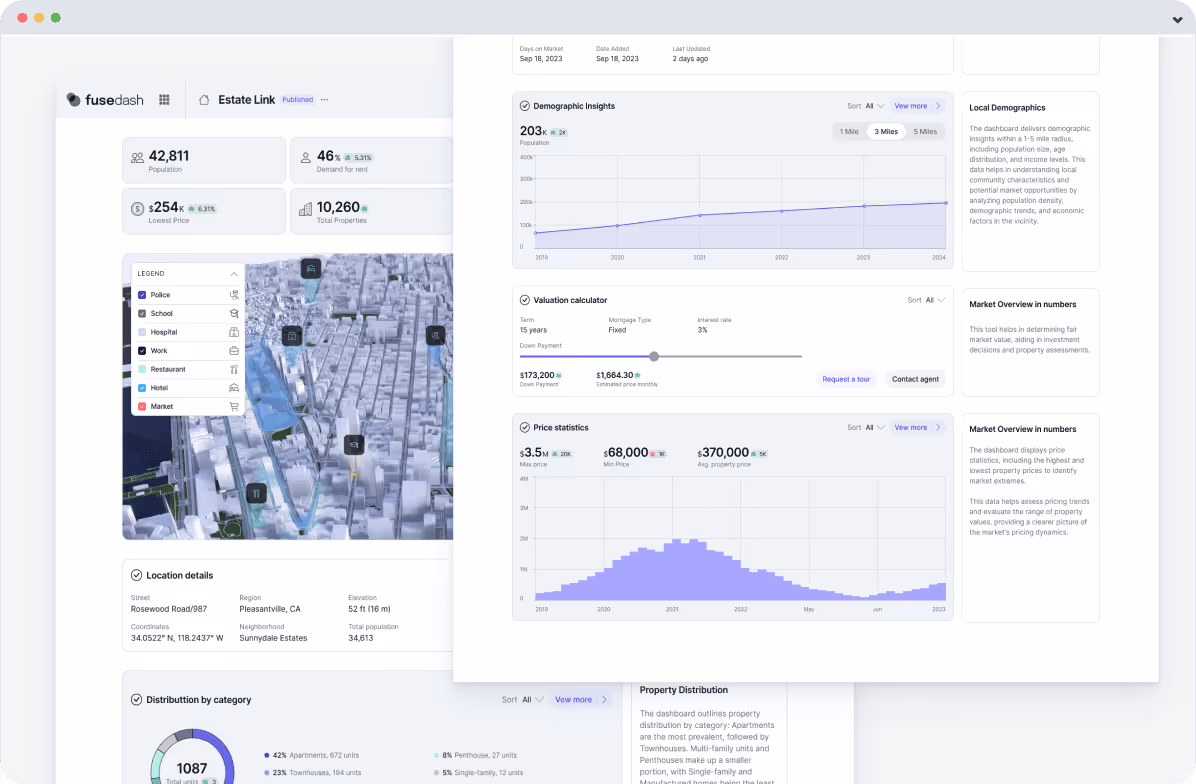
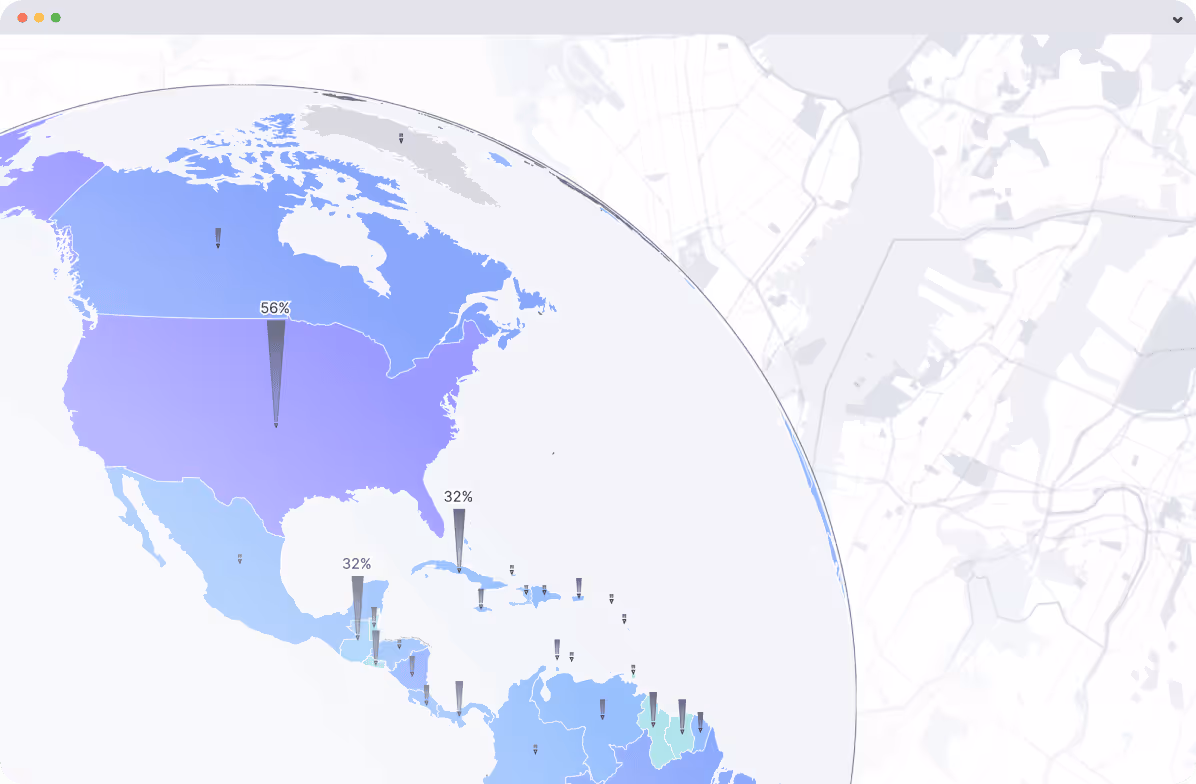
Maps
Generate map visualizations, including choropleths, heatmaps, and point maps for territory analysis, logistics tracking, and regional performance insights.
- Map visualizations for location insights
- Choropleth maps, heatmaps, point maps
- Track sales, coverage, and performance
Chat
Ask questions about your data in plain language. Get answers with supporting charts, breakdowns and context without digging through menus or waiting on a report request.
- Ask questions in plain language
- Get answers with charts and context
- Drill down by region, product, channel
Real-Time Interface
Generate real-time dashboards that auto refresh with live data. Set alerts for spikes, drops and anomalies. Monitor what matters without writing code.
- Real time data visualization that updates
- Alerts for spikes, drops, and anomalies
- Monitor live KPIs without code
Generative Analytics for Every Team and Industry
Choose your context, and Fusedash generates a complete analytics workspace with built-in KPIs, interactive dashboards and real-time monitoring from day one.
Ecommerce / Retail
SaaS Dashboard
Agencies & Client Reporting
Business Leaders
Analysts & BI Teams
Marketing Teams

Why Teams Switch to Fusedash
Traditional dashboard tools make you do the work. Fusedash generates the interface, so your team spends time on decisions rather than configuration.
Stop building dashboards manually
Describe what you need, and Fusedash generates the layout, KPIs and visuals. No drag and drop configuration. No hours spent on formatting.

Get answers without waiting for analysts
Business teams can ask questions, explore data and get chart-backedchart backed answers directly. No more waiting for someone else to rebuild a report.

Ship insights faster with AI-generated views
BI and analytics teams define the metric logic once. Fusedash handles the presentation layer across every team, stakeholder and reporting format automatically.


Build Dashboards With Any AI Model You Choose
Fusedash is built on the Model Context Protocol (MCP), meaning you connect the AI model that fits your workflow, not the one we decided for you. Use Claude, GPT, or any MCP-compatible model to generate dashboards, write KPI summaries, and answer questions about your data. Your data stays in your workspace. Your model choice stays yours.
Frequently asked questions
Everything you need to know about Fusedash and generative analytics.
What does generative analytics mean for my business?
Instead of spending hours configuring dashboard layouts, you describe what you need, and Fusedash generates it from your data. The result is a live, interactive dashboard your team can filter, explore and share without a BI analyst building it manually. Generative analytics means the interface does the work, not your team.
What is Fusedash, and what can I generate with it?
Fusedash is a generative analytics platform that generates interactive dashboards, AI charts, maps, real-time monitoring views and executive reports from your data. Connect your data source once and generate multiple output formats for different audiences, from daily operations monitoring to weekly executive reviews.
How does MCP fit into Fusedash?
With MCP, you can plug in the AI model you prefer to power AI data chat, summaries, and dashboard building workflows. This gives you flexibility to use market-available models while keeping dashboards and reporting views grounded in the same data.
From the Fusedash Blog
Practical guides on AI dashboards, KPI tracking and generative analytics for teams.
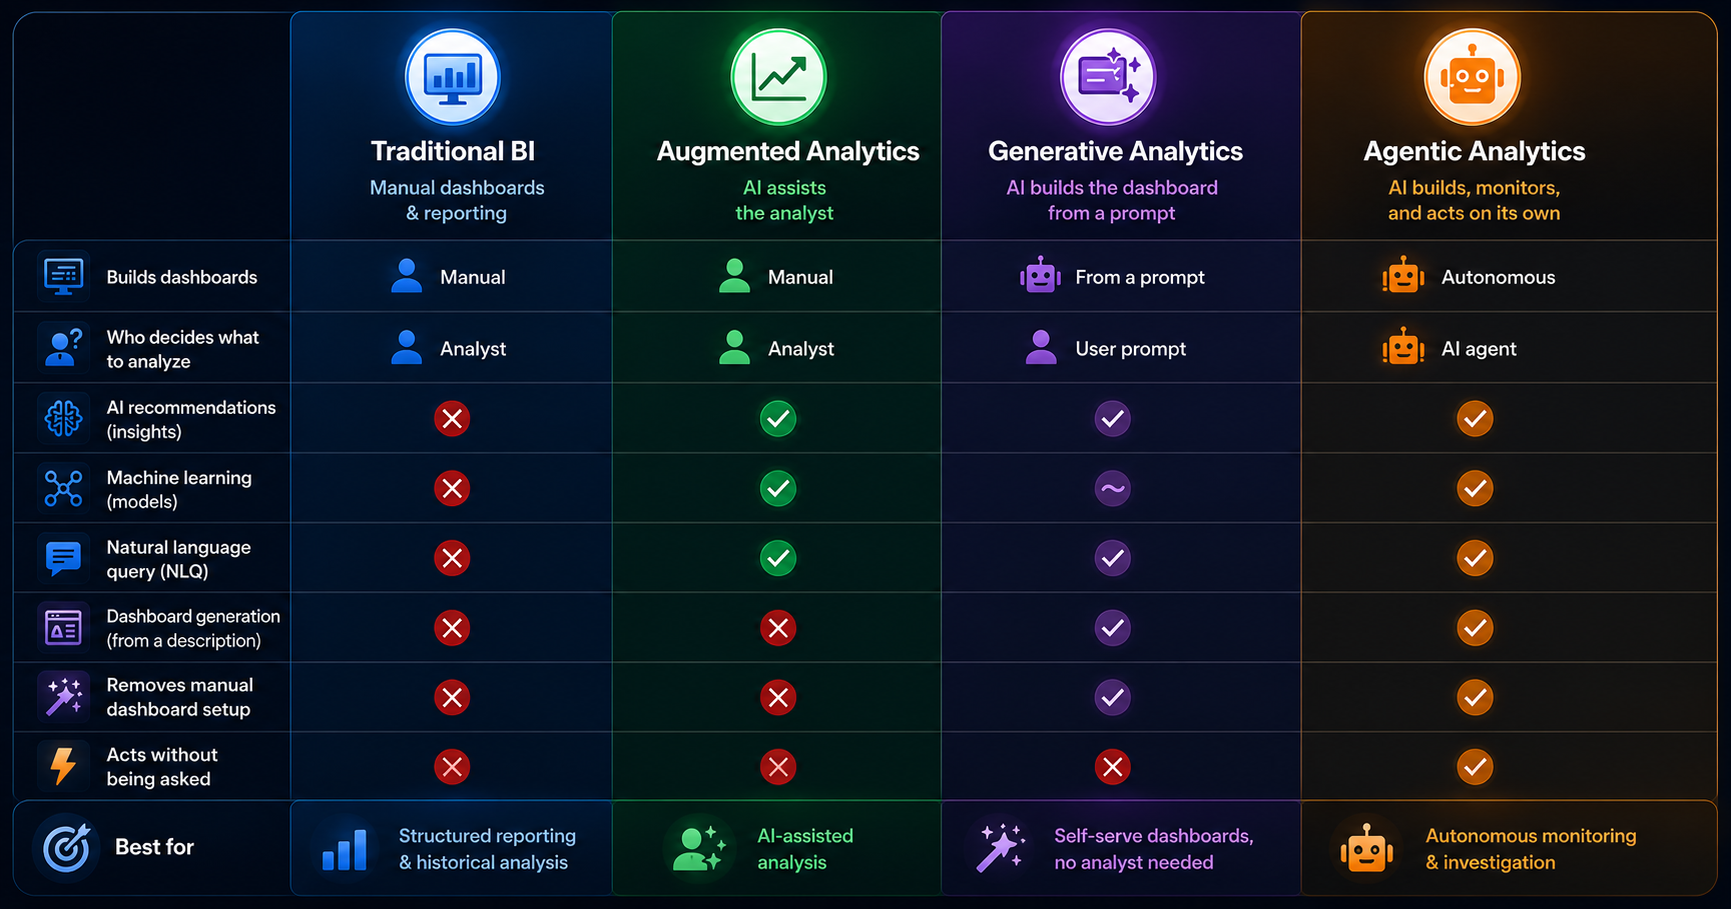
Augmented analytics vs generative analytics vs traditional BI (2026)
Augmented analytics adds AI to a BI tool a person still builds, generative analytics builds the dashboard from a prompt, and agentic analytics runs it. This guide compares all four approaches for 2026, with a who-does-the-work diagram, a 2017-to-2026 timeline, real tool examples, and a simple way to choose.
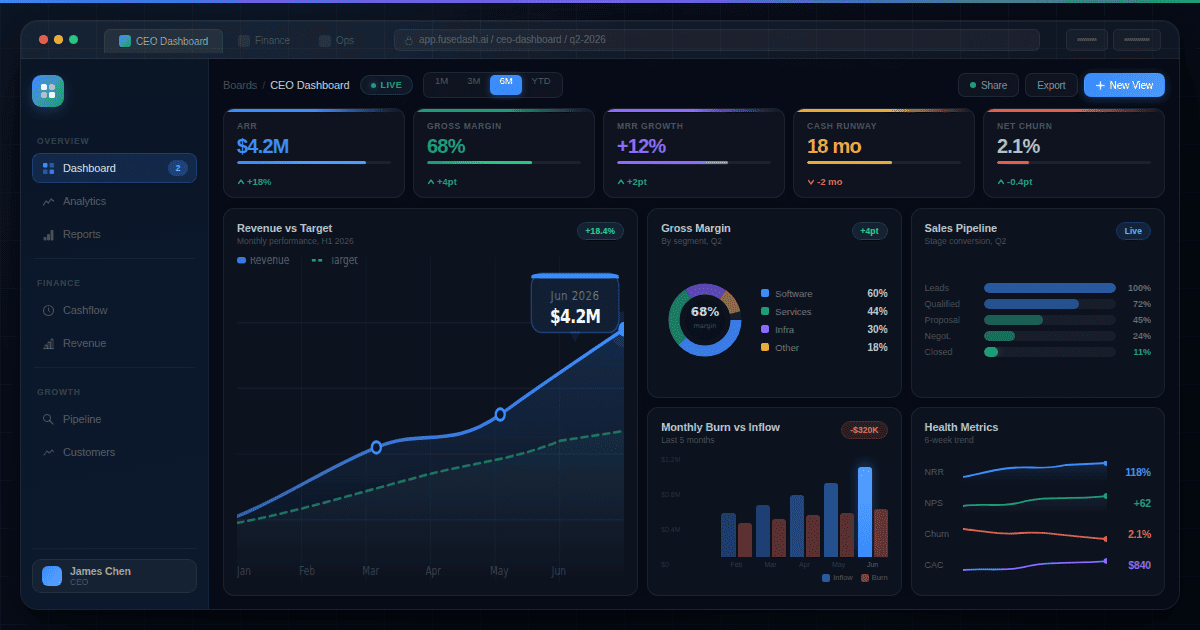
The CEO Dashboard: What Belongs on It at Each Stage and What Doesn't
What belongs on a CEO dashboard changes by stage. A founder needs five metrics; a scale-up CEO needs ten different ones. This guide covers what to track at each stage, the metrics that look CEO-worthy but quietly waste leadership time, and a weekly cadence that turns the dashboard into an operating system.
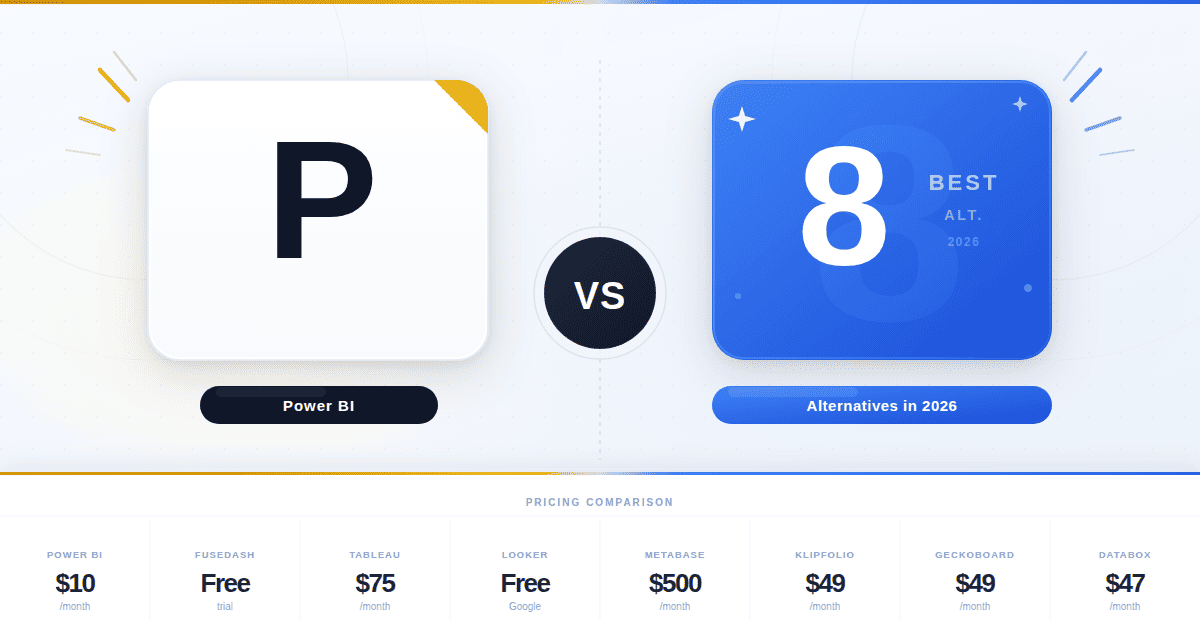
Power BI Alternatives: 8 Tools Worth Considering in 2026
Microsoft's April 2025 Power BI price increase made "leave Power BI" a quarterly board agenda item. We compare the 8 alternatives that data leaders are actually shortlisting in 2026 with verified pricing, honest tradeoffs by buyer archetype, and a migration playbook covering DAX translation across platforms.
Ready to Generate Your First Dashboard?
Start your free trial and generate your first live dashboard from real data before your next meeting.