Featured Article
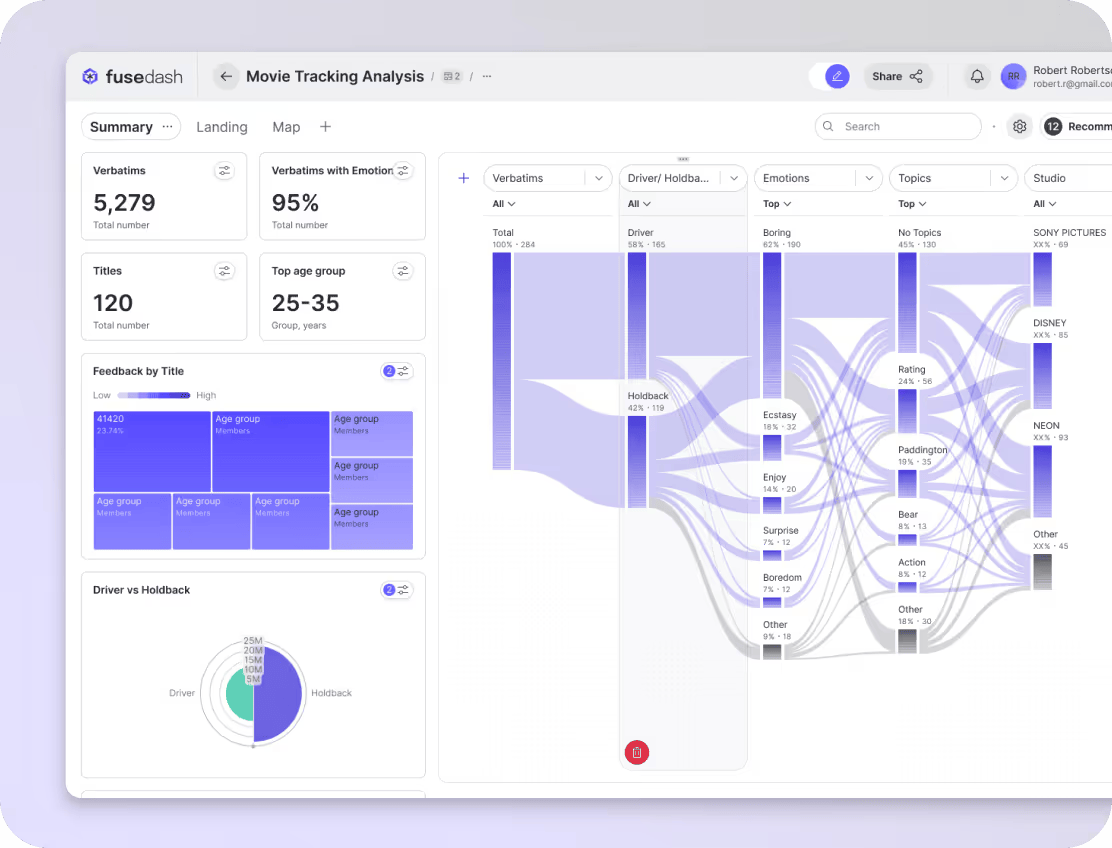
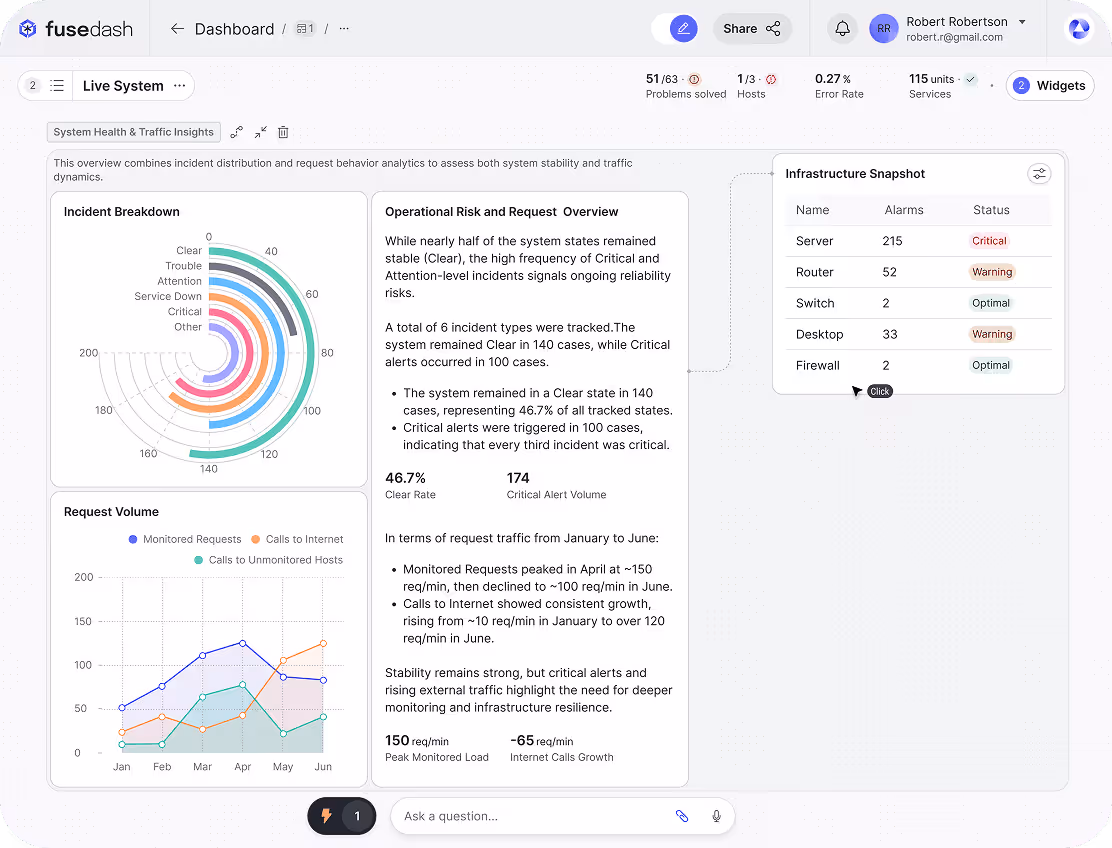
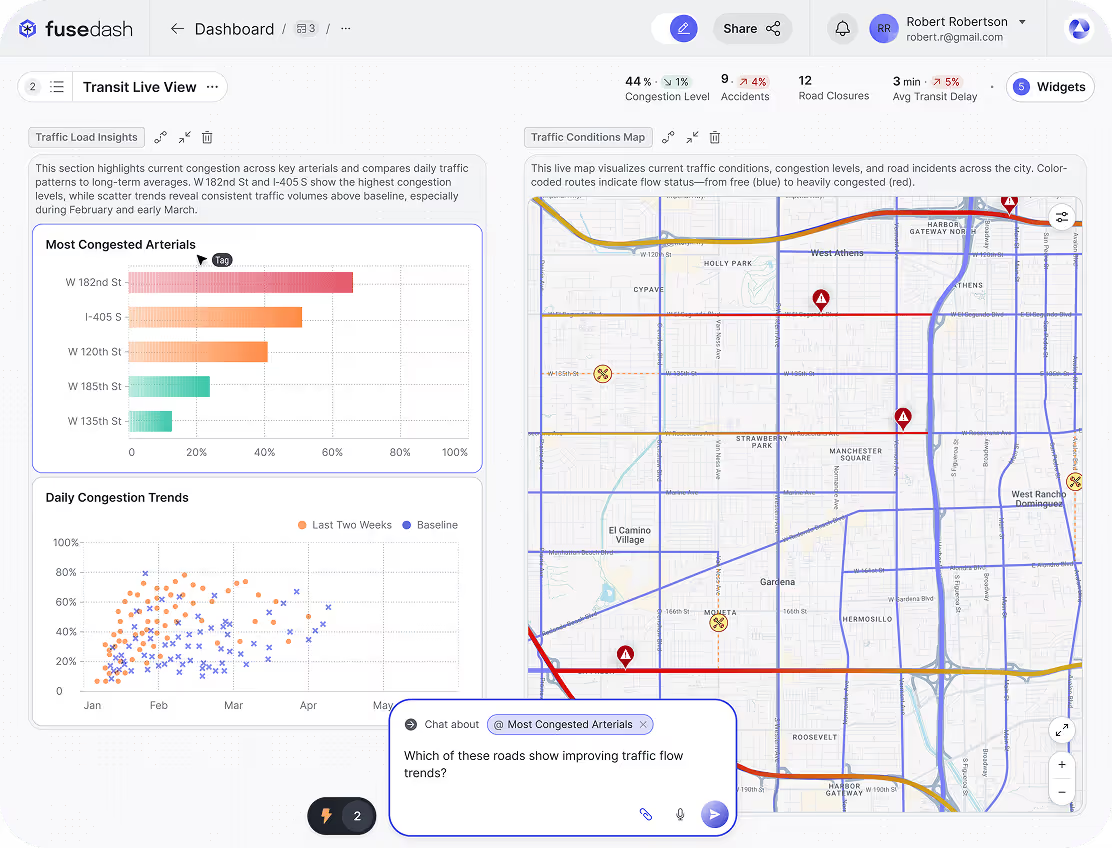
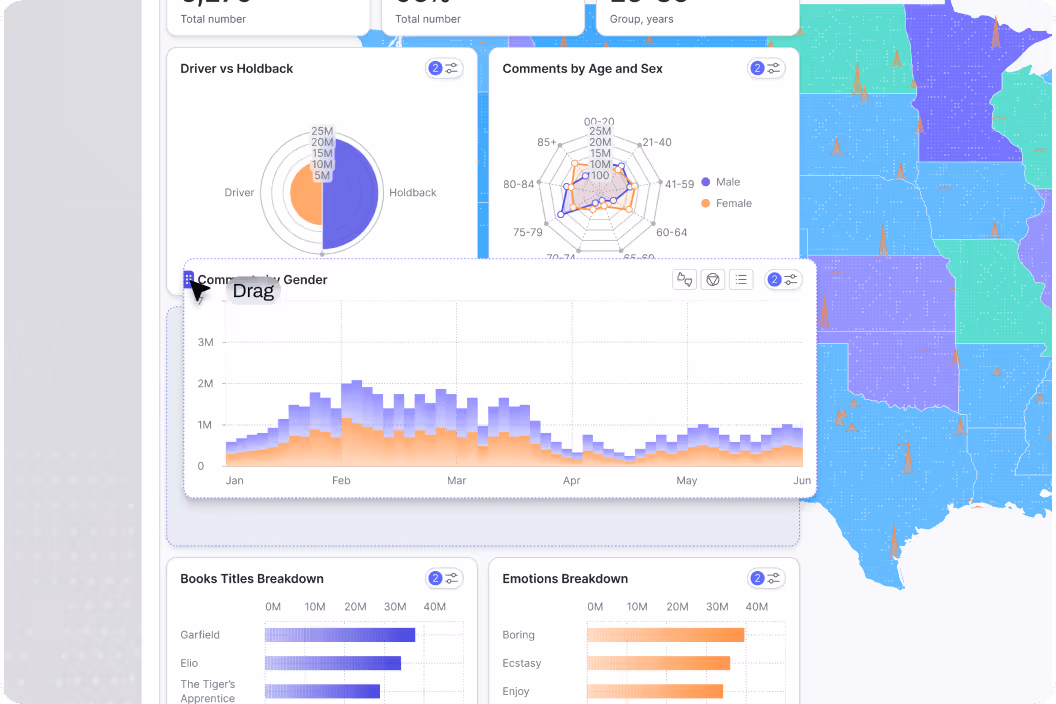
Dashboard Software Explained: Definition, Use Cases, Buying Checklist
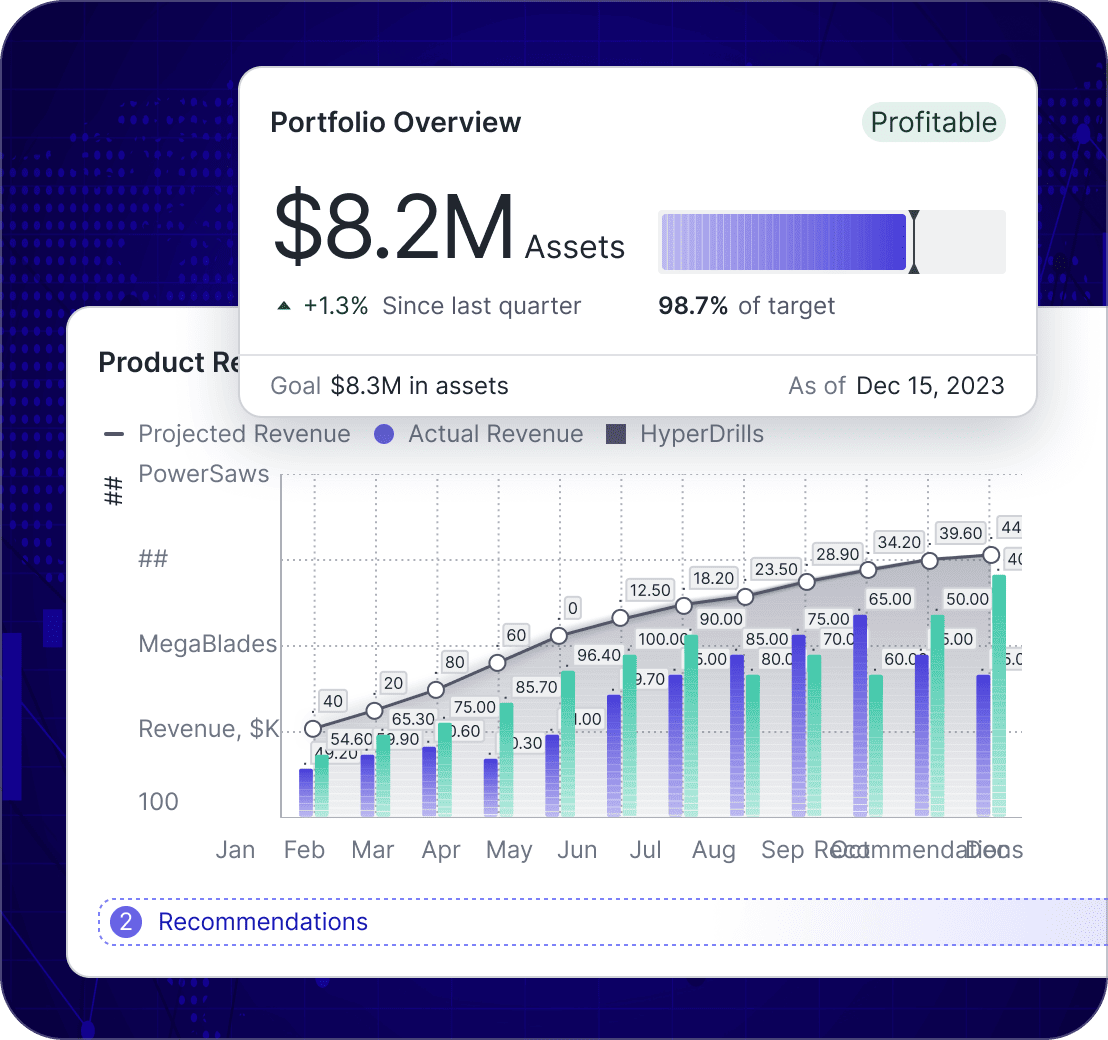
Dashboard software brings your key metrics into one place so teams can monitor performance, spot changes, and act fast. Learn what dashboard software is, when to use dashboards vs reports, and what to look for before choosing a platform.
Read More
.png)
.png)