Business Intelligence Dashboards

Governed BI dashboards with drilldowns, trusted definitions, and shareable views

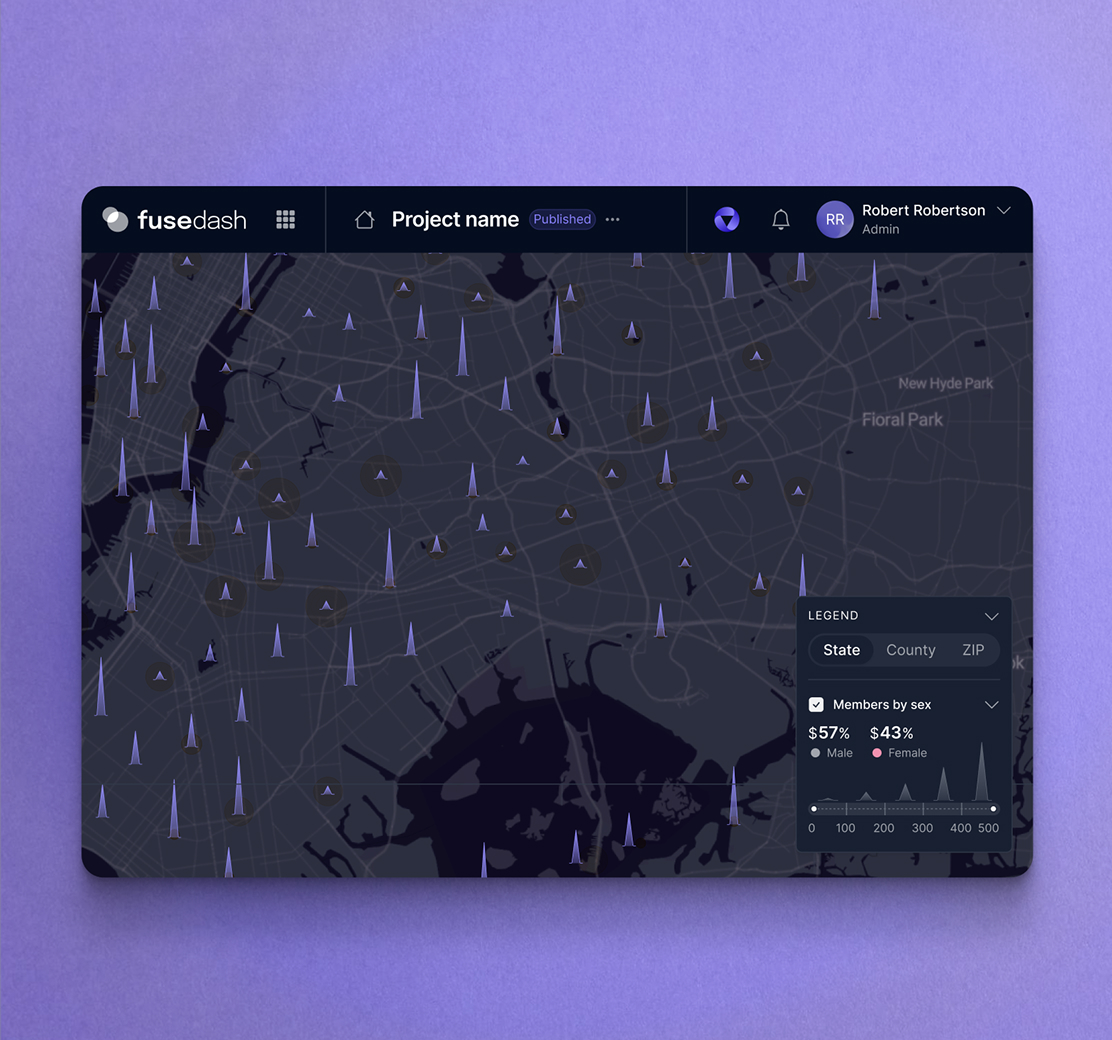
BI teams do not struggle to create charts. They struggle to keep reporting consistent as data sources, definitions, and stakeholders multiply. Fusedash helps you build business intelligence dashboards that keep metrics governed, make exploration fast, and prevent “two versions of the truth” across teams.

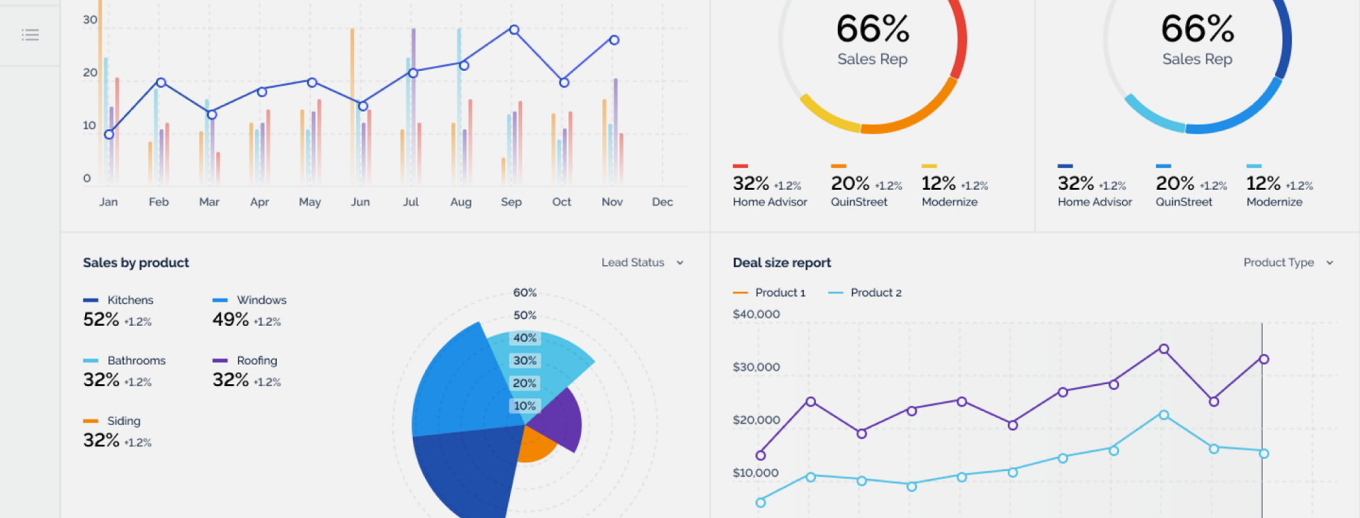
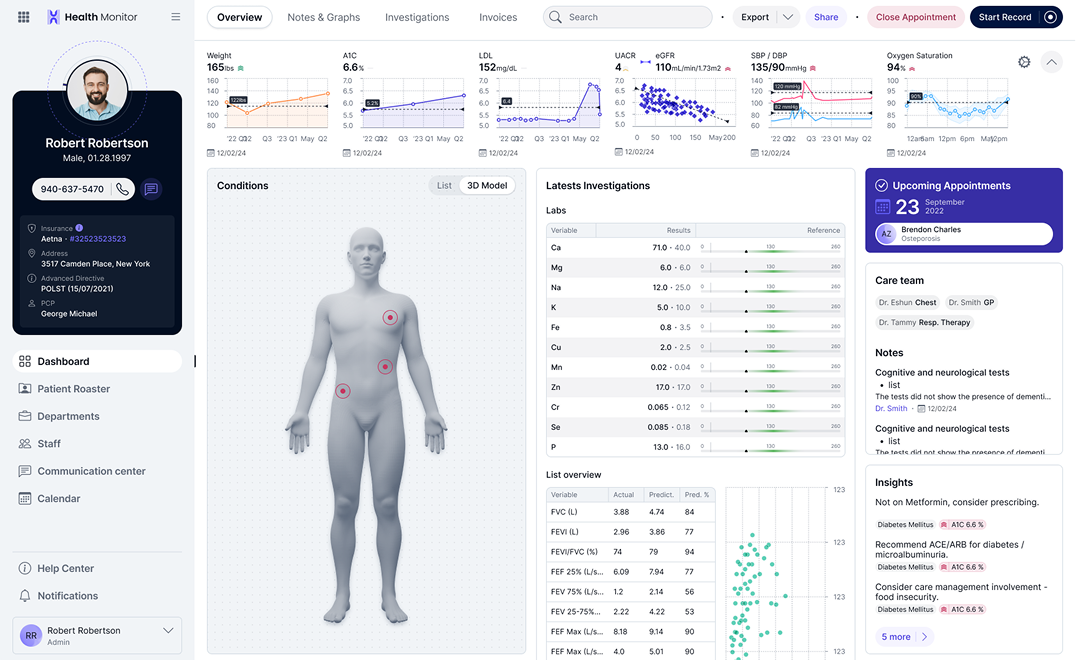
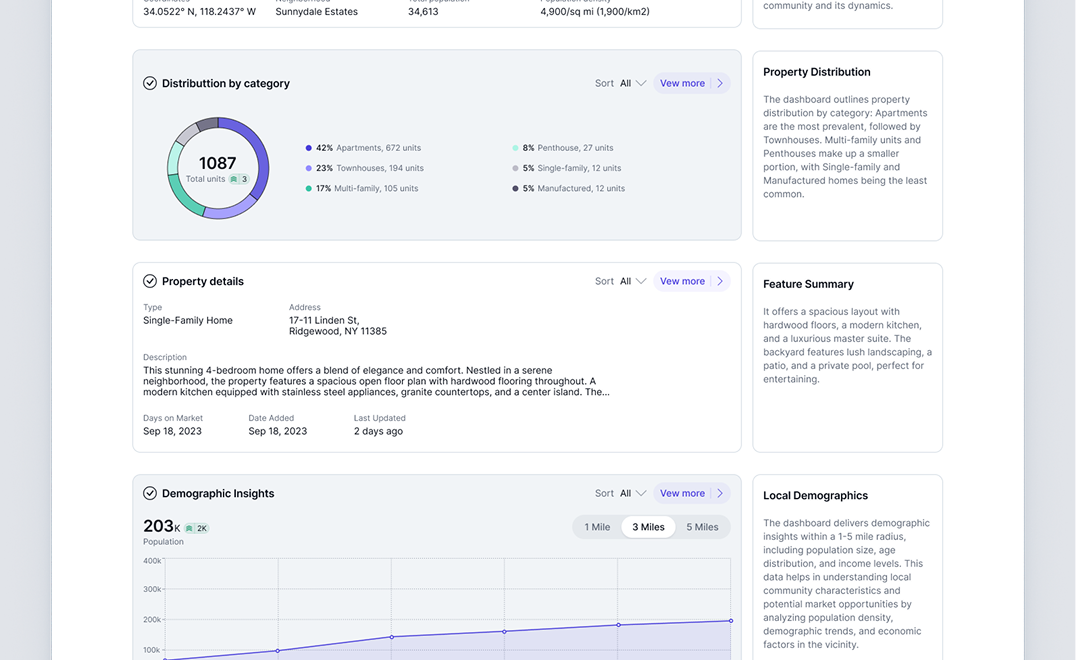
Use these analytics dashboards for weekly performance reviews, operational monitoring, and stakeholder reporting, with drilldowns that answer questions without rebuilding the same work every time. Start with dashboard software. Use charts for clearer comparisons. Add real-time monitoring when freshness matters.

fusedash/ag.drone
BI priorities

What BI dashboards must support in real reporting workflows

Strong interactive BI dashboards do two things at once: they keep metrics consistent, and they make investigation fast. If a dashboard cannot answer follow-up questions quickly, stakeholders export it and rebuild their own version.

Are we looking at the same definition of the KPI across teams and tools?
What changed vs the previous period, and where did the change start?
Which segment explains the movement: region, product, channel, cohort, or account?
Is the change real, or caused by freshness, missing data, or measurement drift?
Can we drill down without changing the KPI baseline or breaking the story?
Can we share the same view so decisions are made on the same numbers?
Dashboard views

BI dashboard views teams use in real reporting workflows

Analysts and BI teams typically need a small set of repeatable views: one for governed metrics, one for exploration, one for operational monitoring, and one for stakeholder reporting.

Dashboard views

BI dashboard views teams use in real reporting workflows

Analysts and BI teams typically need a small set of repeatable views: one for governed metrics, one for exploration, one for operational monitoring, and one for stakeholder reporting.

Insights-Driven Platform
Metric Layer

Governed KPI dashboard

A stable set of KPIs with consistent definitions, period comparisons, and a clear baseline that stakeholders can trust across departments.

Exploration

Interactive drilldown dashboard

Drill into the driver behind a change using filters and breakdowns without rebuilding reports or losing the KPI context.

Monitoring

Operational analytics dashboard

Track freshness-sensitive metrics and identify anomalies early, with views designed for ongoing monitoring rather than one-time reporting.

Stakeholder Reporting

Executive-ready BI dashboard

A clean, readable summary view with a small set of key charts and a consistent structure for recurring reviews.

Getting Started + Builder

How to build business intelligence dashboards in Fusedash

The goal is not “more dashboards.” The goal is fewer dashboards that stakeholders actually use, because definitions are consistent and drilldowns are fast.

Getting Started + Builder

How to build business intelligence dashboards in Fusedash

The goal is not “more dashboards.” The goal is fewer dashboards that stakeholders actually use, because definitions are consistent and drilldowns are fast.

Insights-Driven Platform
01

Connect the sources that define your core KPIs

tart with the data that drives decision-making. Focus on a small set of “must-trust” metrics first, then expand once the baseline is stable.

02

Standardize definitions before adding more visuals

Align KPI definitions across teams, including time windows, filters, attribution rules (if relevant), and how exceptions are handled, so reporting stays consistent.

03

Build comparison-first views

Add period comparisons and trend context so your BI dashboards answer “what changed” immediately.

04

Add drilldowns that match how teams investigate

Create drill paths by segment, region, product, channel, or account so stakeholders can explore without exporting data and fragmenting reporting.

Fusedash Builder

Build BI dashboards teams reuse: governed KPIs, fast drilldowns, and shareable views that keep reporting aligned across the org.

Start a free trial

The BI KPI baseline that prevents metric drift

BI dashboards win when everyone trusts the same numbers. Start with a baseline KPI layer that stays consistent across teams, then use drilldowns to explain movement without changing definitions.

A governed KPI baseline reused across every dashboard and report
Metric definition visibility so stakeholders know what a KPI includes
Segmentation that explains change without rewriting the calculation
Data freshness and completeness checks so the dashboard is trusted

Governed reporting that prevents metric drift

Reporting breaks when two teams answer the same question with different numbers. BI dashboards should reduce debate by making the definition and context clear.

Shared KPI logic used across dashboards and teams
Clear scope and filtering so stakeholders interpret correctly
Stable baseline views for recurring reviews
Consistent naming and structure that prevents confusion

Drilldowns that keep stakeholders out of spreadsheets

Stakeholders export when they cannot investigate inside the dashboard. Make exploration fast so questions get answered without rebuilding the report.

Filters that match real questions by segment and timeframe
Breakdowns that isolate which slice caused the change
Comparisons that show when the shift started
Saved views so repeat questions take seconds, not hours

Stakeholder reporting that stays consistent month after month

BI teams spend too much time re-formatting the same story. Use a repeatable reporting structure that highlights what changed and keeps the narrative clear.

A stable dashboard structure for weekly and monthly reviews
A clear “what changed” focus that drives decisions
Shareable views that reduce screenshot decks
A simple path from summary to drilldown when questions arise
FAQs Section

Business intelligence dashboards FAQs

Common questions BI and analytics teams ask when building governed BI dashboards.

FAQs Section

Business intelligence dashboards FAQs

Common questions BI and analytics teams ask when building governed BI dashboards.

What are business intelligence dashboards?

Business intelligence dashboards are curated views of key metrics used for reporting and decision-making. They keep KPI definitions consistent and make it easy to explore drivers through drilldowns and comparisons.

What makes interactive BI dashboards useful?

Interactive BI dashboards allow stakeholders to filter, segment, and drill down without rebuilding reports. The best ones keep a consistent KPI baseline while enabling exploration.

How do BI teams keep definitions consistent across teams?

Start with a governed KPI set and make time windows, filters, and calculation rules consistent. Then reuse the same KPI logic across dashboards so teams do not diverge.

Can BI dashboards support real-time monitoring?

Yes, when you need freshness-sensitive monitoring. Real-time views help detect anomalies early and respond before the impact grows.

Can we share dashboards with stakeholders and leadership?

Yes. Share a consistent view so teams make decisions on the same definitions and reduce conflicts across reports.

Ready to build governed business intelligence dashboards?

Create BI dashboards with trusted KPI definitions, drilldowns that answer follow-up questions, and shareable views your org can rely on.