Client Dashboard for Agencies

Ship client reporting dashboards that explain results and next steps

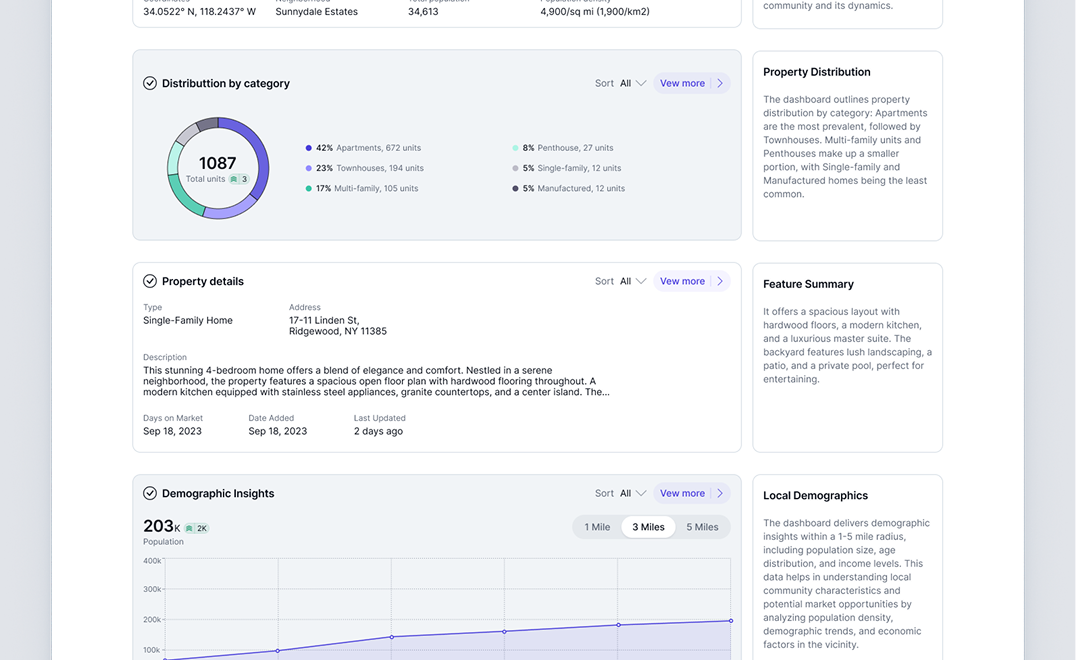
Clients don’t pay for screenshots of ad platforms. They pay for outcomes and confidence. Fusedash helps agencies build a client dashboard that turns fragmented PPC, SEO, analytics, and CRM exports into a client reporting dashboard that answers the real questions: what changed, why it changed, and what we’re doing next.

Use it as a marketing reporting dashboard for daily optimization, and as an agency reporting dashboard for monthly reporting and QBRs. If you manage multiple accounts, it also works as a client dashboard platform that standardizes KPIs across every client without rebuilding reports from scratch. Build the foundation with dashboard software. Turn results into a narrative with data storytelling. For fast investigation during client calls, use Smart Chat.

fusedash/ag.drone
What clients actually ask

What a client dashboard should make obvious in minutes

The point of client reporting is not to “show activity.” It’s to prove impact and guide decisions. A strong client dashboard helps you lead the conversation instead of reacting to questions one by one.

What clients actually ask

What a client dashboard should make obvious in minutes

The point of client reporting is not to “show activity.” It’s to prove impact and guide decisions. A strong client dashboard helps you lead the conversation instead of reacting to questions one by one.

Did we hit the agreed targets, and what moved since last period?
Where did results come from: channel, campaign, landing page, or location?
Are we buying growth efficiently, or are costs rising faster than outcomes?
Which changes matter: tracking, creative, targeting, offer, or funnel friction?
What is the plan for next month: scale, fix, or reposition?
What should the client do next on their side to improve conversion?
Dashboard views

The agency reporting views teams actually deliver

You need views that work for two audiences: clients who want clarity and specialists who want control. These four views cover both.

Dashboard views

The agency reporting views teams actually deliver

You need views that work for two audiences: clients who want clarity and specialists who want control. These four views cover both.

Insights-Driven Platform
Client Summary

Executive client reporting dashboard

A clean monthly view of outcomes, efficiency, and direction: leads or revenue, CPL or CAC, ROAS, and a short “what changed” summary versus the previous period.

Paid Media

Campaign performance dashboard

Break down spend, conversions, CPL, CAC, and ROAS by campaign and channel so your team knows what to scale, pause, or rebuild.

Funnel and Landing Pages

Conversion diagnostics dashboard

Connect traffic to leads and revenue. Segment by landing page, device, location, and campaign to find where drop-offs start and what to test next.

SEO and Content

SEO performance dashboard (visibility to outcomes)

Track organic visibility and traffic as supporting signals, but tie reporting back to leads, assisted conversions, and revenue when data is available.

Getting Started

How to build a client reporting dashboard in Fusedash

The fastest way to lose trust is inconsistent definitions across reports. Build around agreed KPIs first, then expand into deeper diagnostics.

Getting Started

How to build a client reporting dashboard in Fusedash

The fastest way to lose trust is inconsistent definitions across reports. Build around agreed KPIs first, then expand into deeper diagnostics.

Insights-Driven Platform
01

Connect the sources clients care about

Bring together ad spend, analytics, conversion events, and lead outcomes from your CRM or call tracking. Start with what explains results clearly.

02

Standardize KPIs across all accounts

Define what counts as a lead, qualified lead, and conversion. Align attribution logic and naming conventions so dashboards stay consistent month to month.

03

Create two layers: client view and operator view

Build a client-facing summary for clarity, then deeper views for campaign, funnel, and landing page diagnosis. This keeps calls simple and keeps execution fast.

04

Add filters so clients can explore without breaking the story

Add filters for timeframe, channel, campaign, device, and location. Stakeholders can explore safely without changing the KPI baseline.

Fusedash Builder

Build agency dashboards you can reuse: consistent KPI definitions, fast drill-downs, and shareable links that reduce reporting time and improve retention.

Start a free trial

Agency KPIs clients actually care about

A client dashboard works best when you lead with outcomes, then explain the drivers. Start with these KPIs, then break them down by channel, campaign, landing page, and location so clients understand what changed and what to do next.

Leads, qualified leads, bookings, and revenue (when available)
CPL, CAC, ROAS, and cost per opportunity (if tracked)
Landing page conversion rate, form completion, and call rate
Pipeline value, lead-to-opportunity rate, and close rate (if tracked)

Reusable reporting that scales across clients

Agencies waste hours copying the same reporting logic into new spreadsheets. A client dashboard platform should let you reuse a proven structure and swap sources, not rebuild every month.

Standard dashboard layout across all clients
Consistent KPI definitions that prevent “number debates”
Separate internal diagnostic views from client-facing views
Less time formatting, more time improving performance

Turn reporting into a narrative clients understand

The best client reporting dashboards don’t just show metrics. They explain change and make next steps explicit. That improves trust and reduces churn.

Show what changed versus last month and why it changed
Highlight wins and risks with context, not spin
Convert insights into a short action plan for the next period
Keep stakeholders aligned on the same source of truth

Answer client questions faster with Smart Chat

Client calls often include “Can you break this down by location?” or “Which campaigns drove this lift?” Use Smart Chat to generate the right breakdown without building a new report while everyone waits.

Ask: “What changed vs last month and what caused it?”
Break down by campaign, device, or location in seconds
Find why efficiency shifted when spend or conversion rate moved
Save the answer as a reusable view for the next report
FAQs Section

Client dashboard FAQs

Common questions agencies ask when building a client dashboard for recurring client reporting.

FAQs Section

Client dashboard FAQs

Common questions agencies ask when building a client dashboard for recurring client reporting.

What is a client dashboard?

A client dashboard is a shareable view of performance that reports agreed KPIs such as leads, CPL/CAC, ROAS, and revenue or pipeline. It replaces manual reporting with consistent definitions and a clear story.

What should a client reporting dashboard include first?

Start with outcomes and efficiency, then add drivers: channel, campaign, landing pages, and location. Keep SEO metrics as supporting context unless they directly connect to leads or revenue.

How do agencies avoid overwhelming clients with metrics?

Use a client-facing summary with a small KPI set, and keep deeper diagnostics for the internal team. Add a short explanation of what changed and the next action.

Can I share dashboards with multiple stakeholders?

Yes. Share a consistent view so stakeholders see the same numbers and definitions, then let them filter by timeframe or channel without changing the baseline.

Can a client dashboard update automatically?

Yes. When sources are connected, dashboards update based on your refresh rules, so reporting stays current without exports.

Can this work for PPC and SEO in the same dashboard?

Yes. You can report multi-channel performance in one marketing reporting dashboard while keeping the primary focus on outcomes like leads, sales, and pipeline.

Ready to ship client dashboards your clients trust?

Build a client reporting dashboard that reports outcomes, explains what changed, and makes next steps clear. Reduce reporting time and standardize KPI definitions across every client.