Financial Services Dashboard

Monitor product performance, onboarding, and service quality across regions and channels

In banks and fintech, performance problems usually start small. One region drifts, one channel underperforms, or one onboarding step slows down. The cost is not only lost growth, but also a degraded customer experience that is hard to recover later. Fusedash helps you build a financial services dashboard that makes early drift visible and turns investigation into a repeatable workflow.

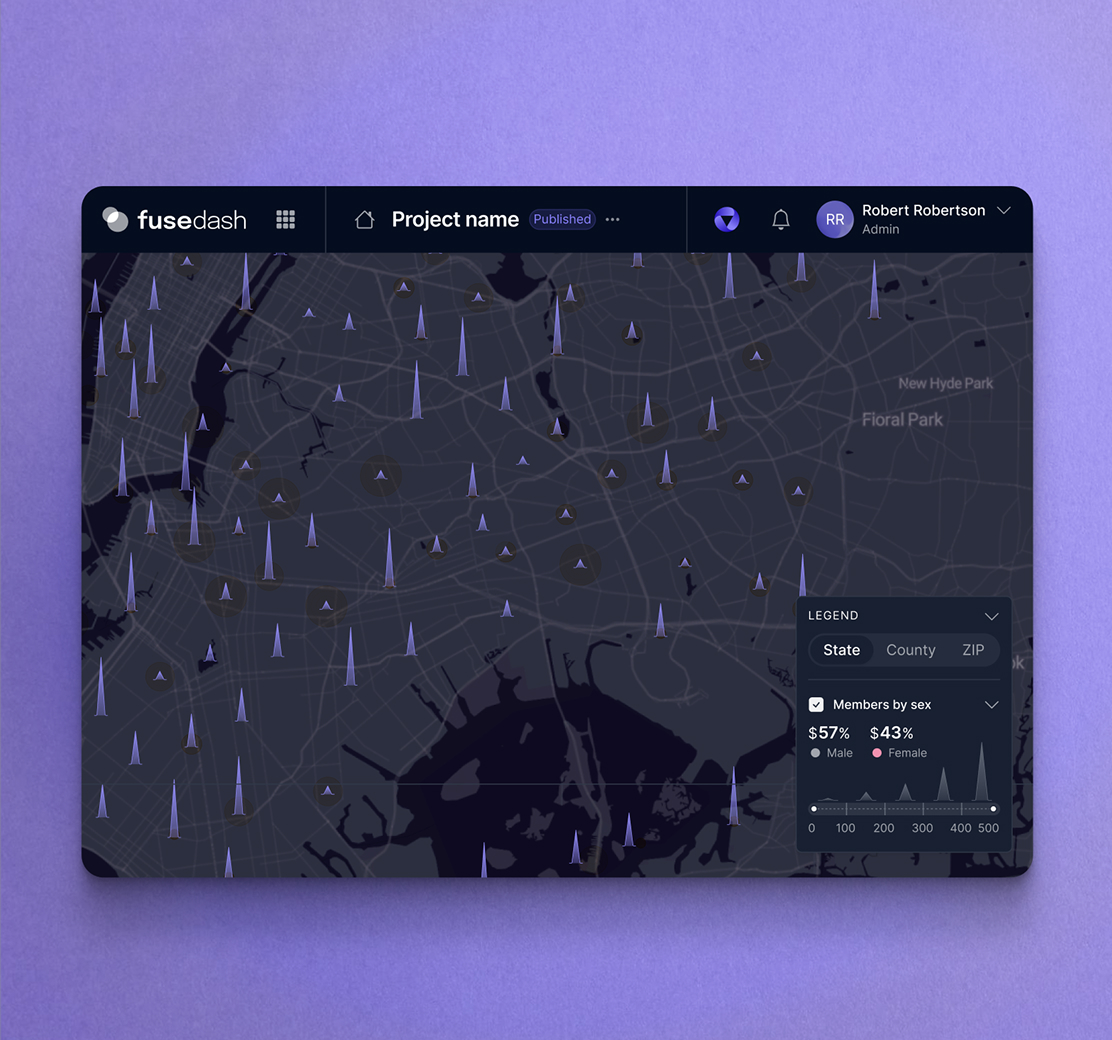
Use it as a banking dashboard for branch and market visibility, and as a fintech dashboard for onboarding, activation, and digital transaction performance across mobile and web. Need the platform view first? Build it with dashboard software. For regional visibility, use maps. For incident windows and spikes, use real-time monitoring.

fusedash/ag.drone
Banking & Fintech Signals

What a banking and fintech dashboard should highlight each day

A financial services dashboard should behave like an early-warning system. It should point you to where the change started, not just confirm that totals moved.

Banking & Fintech Signals

What a banking and fintech dashboard should highlight each day

A financial services dashboard should behave like an early-warning system. It should point you to where the change started, not just confirm that totals moved.

Which metric shifted first: acquisition, activation, transactions, or service load?
Is the change concentrated in one region or spread across markets?
Did performance move in a channel (mobile, web, branch, partner) or a product line (cards, payments, deposits, lending)?
Are onboarding completion and time-to-activate improving or degrading?
Is transaction success rate stable, or are errors rising during peak periods?
What should happen next: drill down by segment, compare periods, or escalate to an owner?
Operating views

The financial services views teams rely on

Leadership, regional owners, product teams, and operations teams need different lenses. These views reflect how banks and fintech teams actually investigate performance.

Operating views

The financial services views teams rely on

Leadership, regional owners, product teams, and operations teams need different lenses. These views reflect how banks and fintech teams actually investigate performance.

Insights-Driven Platform
Leadership View

Executive performance dashboard

A clean overview of the core KPIs that matter, plus comparisons that show direction without noise across products, channels, and regions.

Branch & Region

Regional and branch performance dashboard

Compare branches and regions with ranked trends, then drill down to see which products and channels explain the change.

Product Growth

Product and channel dashboard

Track product adoption and digital usage across channels, then segment by customer type to see whether growth is coming from the right cohorts.

Service Health

Transaction reliability dashboard

Monitor success rate and error rate alongside volume so you can detect experience degradation early and route investigation to the right owners.

Getting Started

How to build a financial services dashboard in Fusedash

Build for speed of diagnosis. The first dashboard should tell you what moved and where it moved in minutes, then evolve into deeper views for product, region, and channel.

Getting Started

How to build a financial services dashboard in Fusedash

Build for speed of diagnosis. The first dashboard should tell you what moved and where it moved in minutes, then evolve into deeper views for product, region, and channel.

Insights-Driven Platform
01

Connect the data that explains movement

Import CSVs or connect APIs for customer activity, onboarding events, product usage, transaction outcomes, and operational signals. Standardize KPI definitions so teams trust the same numbers.

02

Start with one primary lens

Pick the lens that matches how you run the business: region, channel, or product. Add other lenses after the first view becomes part of the daily rhythm.

03

Build comparisons that expose drift

Use period comparisons (WTD vs last week, MTD vs prior MTD) and breakdown tables by region, segment, product, and channel to isolate the driver.

04

Add filters that match ownership

Filters for branch, region, channel, product line, segment, and timeframe make it easy to assign action to the right team without rebuilding reports.

Fusedash Builder

Build dashboards teams can use daily: consistent KPI definitions, fast drill-downs, and shareable views for leadership and operators.

Start a free trial

Financial services KPIs teams align on

Keep your financial services dashboard consistent by aligning on a small KPI set first. Then break it down by region, product line, channel, and segment to spot drift early and act fast.

Customer and growth: new customers, active customers, returning usage trend
Product performance: adoption and volume by product line and segment
Onboarding and activation: completion rate, time-to-activate, step drop-off
Service quality: transaction success rate, error rate, support load during peak periods

Channel performance monitoring for digital banking

When mobile or web performance slips, totals can hide the problem until churn rises. Track channel mix and key flow conversion so you see friction as it starts.

Conversion for key flows (sign up, verification, first action)
Drop-off by device type and channel
Peak-period performance and incident windows
Compare channels side-by-side to isolate where the change began

Regional drift detection for branches and markets

Regional visibility turns “we are down overall” into “this market started drifting on Tuesday.” That clarity reduces broad investigations and makes ownership obvious.

Rank regions and branches by trend, not only totals
See whether change is product-driven or channel-driven
Compare markets fairly using the same time windows
Share a filtered view with the regional owner responsible

Onboarding and activation troubleshooting

Growth depends on completion and time-to-value. If onboarding slows, next month’s revenue follows. Track each step so teams can fix the driver before it hits retention.

Completion rate and time-to-activate trend
Step-level drop-off (verification, funding, first action)
Segment by region, channel, and customer type
Monitor sudden shifts after releases and campaigns
FAQs Section

Financial services dashboard FAQs

Common questions teams ask when building a banking dashboard or fintech dashboard for performance monitoring.

FAQs Section

Financial services dashboard FAQs

Common questions teams ask when building a banking dashboard or fintech dashboard for performance monitoring.

What is a financial services dashboard?

A financial services dashboard is a centralized view of performance metrics across products, channels, and regions. It helps teams detect drift early, identify drivers, and act using consistent KPI definitions.

What is the difference between a banking dashboard and a fintech dashboard?

A banking dashboard often emphasizes regional and branch trends plus channel mix. A fintech dashboard typically focuses more on onboarding, activation, digital usage, and transaction reliability.

Which KPIs should I include first?

Start with customer activity, onboarding completion, channel mix, product usage, and transaction success rate. Then break them down by region, branch, product line, and segment.

Can this dashboard update in real time?

Yes. Real-time monitoring is most useful for transaction reliability, onboarding shifts, and channel spikes where delays increase impact.

Can I filter dashboards by region, branch, product, or channel?

Yes. Use filters for region, branch, channel, product line, segment, and timeframe to isolate the driver behind drift quickly.

Can I share this dashboard with stakeholders?

Yes. Share a consistent view so leadership and teams use the same KPI definitions and avoid conflicting numbers across reports.

Ready to build a decision-ready financial services dashboard?

Monitor banking and fintech performance across products, channels, and regions with a single source of truth. Track onboarding, activation, and transaction reliability, then drill down to the driver fast.