Executive Dashboard

Leadership-ready visibility for revenue, cash, pipeline, and customer health

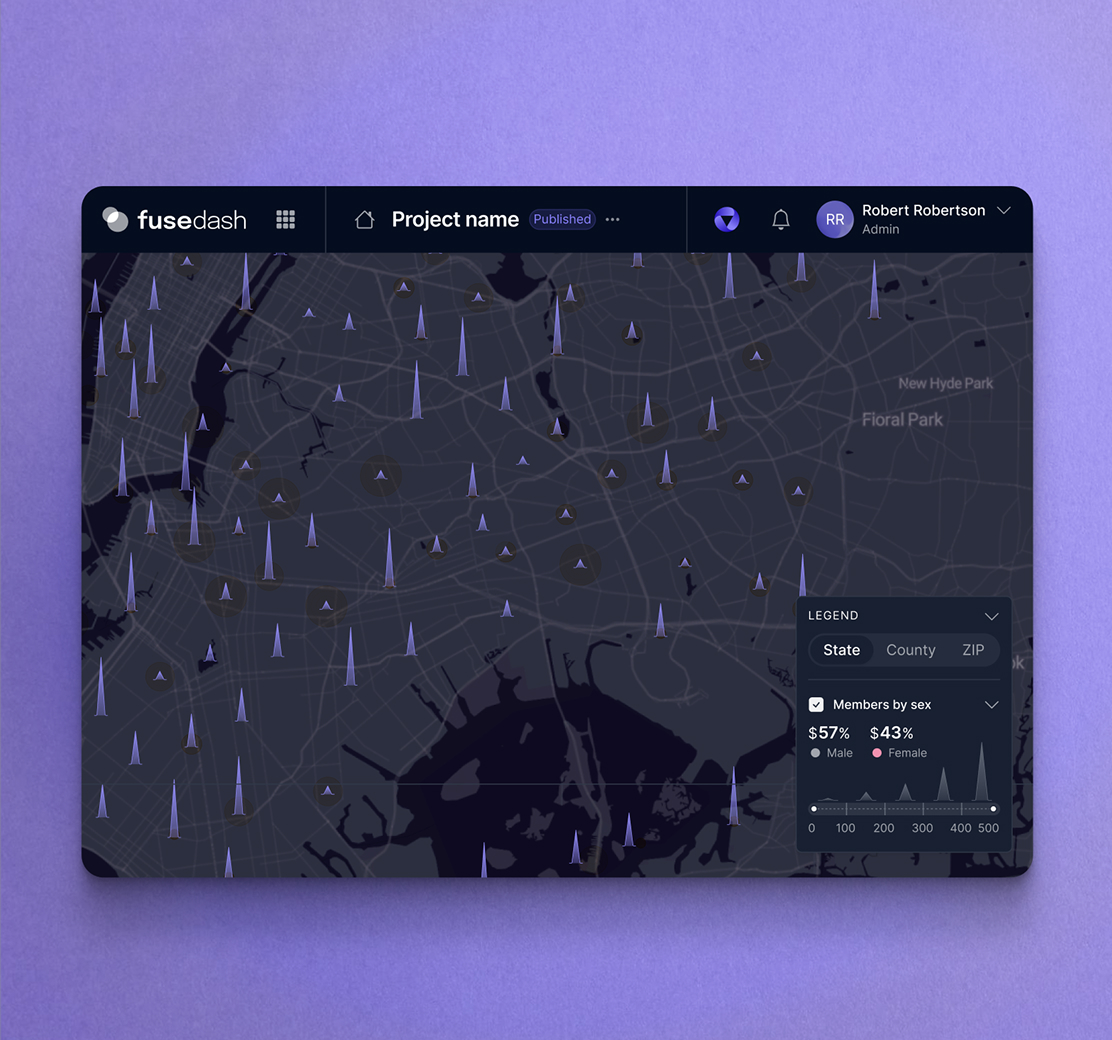
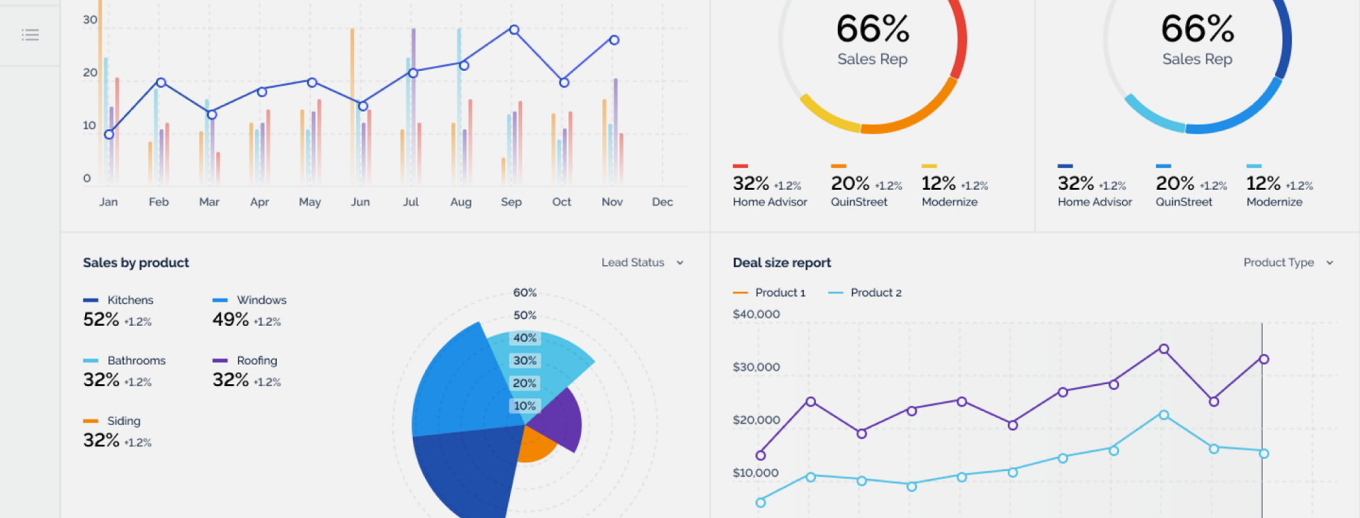
Leadership does not need more dashboards. You need one executive dashboard that makes the business state obvious, highlights what changed, and supports the next decision. Fusedash helps you build an executive reporting dashboard that pulls your core metrics into a single view, with trends, comparisons, and drill-downs when you need detail.

Use it as a CEO dashboard for weekly leadership reviews, a leadership dashboard for cross-team alignment, and a recurring executive dashboard reporting view for monthly business reviews that stays consistent even as your team grows. Start with our dashboard software. Add clearer executive visuals with charts. Turn results into a narrative with data storytelling.

fusedash/ag.drone
Leadership questions

What an executive dashboard should answer before the meeting starts

A strong executive dashboard reporting view gives you clarity fast. It should tell you if the business is healthy, where it is drifting, and what deserves attention today.

Leadership questions

What an executive dashboard should answer before the meeting starts

A strong executive dashboard reporting view gives you clarity fast. It should tell you if the business is healthy, where it is drifting, and what deserves attention today.

Are we ahead or behind plan, and what moved since last period?
Is growth coming from pipeline, conversion, retention, or price and mix?
Are we accumulating risk in cash, churn, support load, or delivery capacity?
Which segment, region, or product line explains the change?
What is the next decision: invest, cut, fix, or wait for more signal?
What should each leader own after this review?
Dashboard views

The executive views leadership teams actually use

Leadership needs a small set of recurring views that stay stable across quarters. These are the executive dashboards most teams adopt first.

Dashboard views

The executive views leadership teams actually use

Leadership needs a small set of recurring views that stay stable across quarters. These are the executive dashboards most teams adopt first.

Insights-Driven Platform
Business Health

Executive summary dashboard

A one-page view of top KPIs with trends and comparisons that show direction without noise, plus a short “what changed” snapshot.

Revenue and Pipeline

Revenue and pipeline dashboard

Track revenue, pipeline value, conversion, and forecast direction signals so leadership can see whether growth is building or stalling.

Customer Health

Customer health dashboard

Monitor retention direction, expansion signals, and support load indicators so risks are visible before they become churn.

Execution and Delivery

Operations performance dashboard

A leadership lens on capacity, cycle time, and delivery reliability signals, so resourcing decisions are grounded in reality.

Getting Started + Builder

How to build an executive dashboard in Fusedash

Executive dashboards fail when they try to include everything. Start with a decision-ready core, then expand only when the view proves useful in real leadership reviews.

Getting Started + Builder

How to build an executive dashboard in Fusedash

Executive dashboards fail when they try to include everything. Start with a decision-ready core, then expand only when the view proves useful in real leadership reviews.

Insights-Driven Platform
01

Connect the systems that define business performance

Pull in the metrics leadership relies on, such as revenue, pipeline, cash signals, retention, and service health. Start with the minimum needed to explain change clearly.

02

Agree on KPI definitions and owners

Define what counts as revenue, pipeline, churn, and customer health. Assign owners so the dashboard drives accountability, not debates.

03

Build comparisons that make drift obvious

Use week-to-date, month-to-date, and prior-period comparisons so leadership can see direction quickly and ask better questions.

04

Add drill-down paths, not clutter

Keep the executive view clean, then let leaders drill into segment, region, product line, or funnel stage when the headline changes.

Fusedash Builder

Create an executive dashboard your leadership team will actually use: clear KPI definitions, fast drill-downs, and consistent reporting that survives growth.

Start a free trial

Financial services KPIs teams align on

A CEO dashboard becomes useful when it shows outcomes and early warning signals in the same view. Start with these KPIs, then break them down by region, product line, or segment when something moves.

Revenue trend, gross margin direction, and variance vs plan
Pipeline value, win rate, and sales cycle movement
Cash signals and runway direction (based on your inputs)
Customer health signals, retention direction, and support load trend

What changed, and why it changed

Executive reporting breaks down when leaders get totals without context. Build a view that connects the change to a driver so decisions are faster and meetings are shorter.

Period comparisons that highlight the shift clearly
Breakdowns by segment, product line, region, or channel
Simple notes that capture the driver behind the change
A clear next action tied to an owner

Real-time visibility for fast-moving risks

Some issues are too expensive to discover at month-end. Real-time monitoring helps leadership spot early drift and respond while impact is still manageable.

Sudden pipeline drop or conversion rate change after launches
Support spikes that signal customer experience risk
Operational bottlenecks that threaten delivery timelines
Revenue anomalies during promotions or billing cycles

Leadership alignment without reporting chaos

Executive dashboard reporting breaks when every team brings a different number to the meeting. Use one shared view with consistent definitions so decisions are faster, ownership is clear, and follow-ups are automatic.

One set of KPI definitions used across teams and reports
Shared views for leadership, finance, sales, and operations
Notes and decisions captured next to the metrics that triggered them
Clear follow-ups tied to owners and review cadence
FAQs Section

Executive dashboard FAQs

Common questions leaders ask when building an executive dashboard for recurring leadership reviews.

FAQs Section

Executive dashboard FAQs

Common questions leaders ask when building an executive dashboard for recurring leadership reviews.

What is an executive dashboard?

An executive dashboard is a leadership view of business performance that tracks a small set of core KPIs, shows trends and what changed, and supports decisions with drill-downs when needed.

What should a CEO dashboard include first?

Start with revenue and margin direction, pipeline signals, cash direction, and customer health. Then add breakdowns by segment, product line, and region to explain movement.

How do we avoid the executive dashboard becoming cluttered?

Keep one clean executive summary view, then provide drill-down paths for deeper detail. Add new metrics only when they consistently inform decisions.

Can we share executive dashboard reporting with department heads?

Yes. Shared views keep leadership and teams aligned on the same definitions and reduce conflicting numbers across reports.

Can an executive dashboard update in real time?

Yes. Real-time monitoring is useful for fast-moving risks like pipeline changes, operational bottlenecks, and customer experience signals.

Ready to build a leadership-ready executive dashboard?

Track revenue, cash direction, pipeline health, and customer signals in one executive dashboard. Share consistent reporting, spot what changed, and drill into the driver fast.